My Server Response Times Suck! What Gives?

Alteran Ancient

Well-known member
This is a question that I was hoping someone might be able to answer for me.

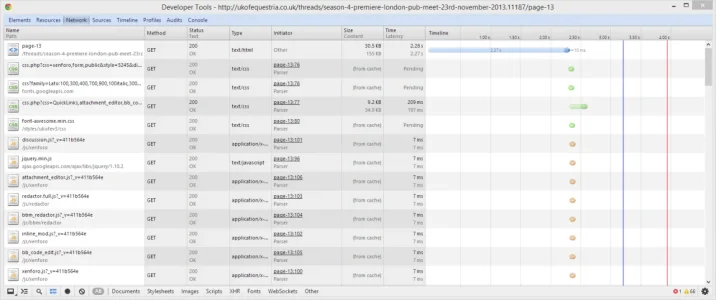
My website's response times are highly erratic, and more often than not, slow into the seconds. With Debug enabled on my XF forum, load times are anywhere between 0.4 seconds and 4 seconds or more. I was using Nginx + PHP/FastCGI + XCache but switched over to PHP-FPM + APC on Sunday. Average server load dropped marginally as did memory usage, but server responsiveness utterly blows when I have just around 150 users on the site at one time.

My DNS records are also pumped through CloudFlare, so there's that too. Helps with the caching effort quite a bit. Doesn't help with the server response times.

The SQL queries are taking almost no time to execute (0.2 seconds down to 0.05 during quieter periods), so it can't be that. Upon checking htop on the VPS, CPU on the various php-fpm threads is fluctuating constantly up to 15%.

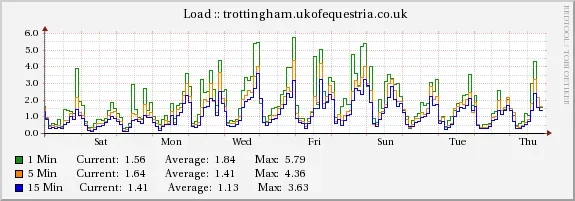
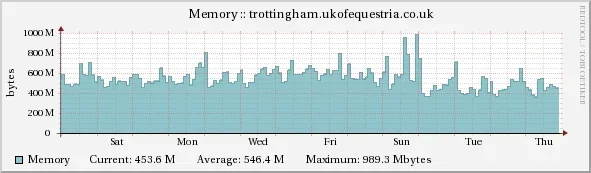
The load and memory stats are attached - I made the tweaks mentioned above on Sunday, to no avail. Was abandoning Apache all those months ago an unproductive waste of my time? Any ideas or suggestions you could give will be greatly appreciated.
 

Attachments

  • t-ukofe-load.webp
    t-ukofe-load.webp
    27 KB · Views: 40
  • t-ukofe-mem.webp
    t-ukofe-mem.webp
    20.9 KB · Views: 35
Last edited:
Has this been happening for a while?
It's been getting worse the past few weeks. I wanted to see if I could improve it, so I switched from one particular FastCGI configuration over to FPM. It doesn't seem to have much the desired effect, and if anything, is worse at times when there are more users on.

I'm just wondering if I'm missing something massive, because I hear all this noise about how amazing Nginx is supposed to be (I switched over to it once before but moved back to Apache because of slow performance issues and memory ballooning). Every time I've tried it, it's sucked.

I can spew out config files and what-not, just in case there's one golden value that happens to be mis-configured. Short of that, I can't see any solution other than bailing and going back to Apache yet again (which I really don't want to do).

Is it always slow or is it during certain times of the day?
 
Anything in your server error logs for those time frames?
The only errors I could really spot were these ones...
Code:
2013/11/21 22:16:10 [error] 8202#0: *615140 FastCGI sent in stderr: "Primary script unknown" while reading response header from upstream, client: 186.X.X.242, server: www.ukofequestria.co.uk, request: "GET /members/abrony-mouse.534/css.php?css=SecretCurl,bb_code,bbm_buttons,facebook,likes_summary,login_bar,member_view,message_simple,nat_public_css,panel_scroller,sidebar_share_page&style=30&dir=LTR&d=1385038779 HTTP/1.1", upstream: "fastcgi://127.0.0.1:9000", host: "ukofequestria.co.uk", referrer: "http://ukofequestria.co.uk/members/abrony-mouse.534/"
2013/11/21 22:16:11 [error] 8202#0: *615140 FastCGI sent in stderr: "Primary script unknown" while reading response header from upstream, client: 186.X.X.242, server: www.ukofequestria.co.uk, request: "GET /members/abrony-mouse.534/css.php?css=xenforo,form,public&style=30&dir=LTR&d=1385038779 HTTP/1.1", upstream: "fastcgi://127.0.0.1:9000", host: "ukofequestria.co.uk", referrer: "http://ukofequestria.co.uk/members/abrony-mouse.534/"
2013/11/21 22:26:27 [error] 8202#0: *618047 FastCGI sent in stderr: "PHP message: XML-RPC: xmlrpc_server::execute: function get_alert_func registered as method handler does not return an xmlrpcresp object" while reading response header from upstream, client: 188.X.X.44, server: www.ukofequestria.co.uk, request: "POST /mobiquo/mobiquo.php HTTP/1.1", upstream: "fastcgi://127.0.0.1:9000", host: "ukofequestria.co.uk"
2013/11/21 22:31:43 [error] 8200#0: *619398 FastCGI sent in stderr: "Primary script unknown" while reading response header from upstream, client: 109.X.X.2, server: www.ukofequestria.co.uk, request: "GET /threads/last-pony-standing-extreme-version.6902/css.php?css=xenforo,form,public&style=30&dir=LTR&d=1385038779 HTTP/1.1", upstream: "fastcgi://127.0.0.1:9000", host: "ukofequestria.co.uk"
 
I just re-read your OP and see that you're on CloudFlare, which I guess a lot of people have problems with.

@Mike will definitely be able to help you here, in that case.
 
CloudFlare can definitely have its share of problems. Try accessing your site/IP without going through CF and see if there is any change. That would help narrow things down.
 
CloudFlare can definitely have its share of problems. Try accessing your site/IP without going through CF and see if there is any change. That would help narrow things down.

I'd say give this a shot.

I'd also like to know what the output of "top" command in SSH looks like during a time of slowness. Can you PM me your domain as well?
 
CloudFlare itself wouldn't cause server slowdowns that are described.

Do you have a "direct" subdomain set up in CloudFlare? If you do, see if you can access that, to see if its faster. It might be named something else other than "direct".
http://direct.ukofequestria.co.uk

This is the CloudFlare status page to see if there are any network issues:
https://www.cloudflare.com/system-status

Can you disable your APC caching and see if that speeds things up? Maybe you're getting a lot of fragmentation.

Are your Apache processes still running after switching to nginx?
 
Last edited:
Use Chrome or Firefox dev tools to see if there's a specific script or request on your forum holding things up. I use Chrome for most of my testing so I'll type up those instructions for you:

Press F12 to open up the Chrome dev console.

Click the Network tab. Right click the white space and click "Clear browser cache".

Reload the page and watch the results.

This will give you a breakdown of each HTTP request by script and static elements. It will show you hierarchically what is loading when and exactly how long it's taking so you should be able to see what's holding up your page loads.
 
  • Like
Reactions: LPH
Apologies for the delay in coming back to this. I "paused" CloudFlare for a little while, and didn't see any sort of improvement, so figured I'd turn it back on for the time being.

Page loading times on debug mode appear to be anywhere between 0.2 and 5 seconds, with SQL queries not going above 0.05 seconds. So the problem lies within the page processing in Nginx/PHP-FPM somewhere.

Are your Apache processes still running after switching to nginx?
This VPS was set-up for the intention of using Nginx - we moved away from a server using Apache. I'm now tempted to install Apache, set up the vhosts and .htaccess and just switch back over to Apache/mod_php to see what happens.
 

Attachments

  • NetAnalyse.webp
    NetAnalyse.webp
    50.8 KB · Views: 3
@Alteran Ancient, post a link to your site.
http://ukofequestria.co.uk - As per my profile and as SneakyDave worked-out!

Do you have a "direct" subdomain set up in CloudFlare? If you do, see if you can access that, to see if its faster. It might be named something else other than "direct".
Yep. Enquire via PM if you'd like to get involved and get the domain that bypasses the reverse proxy. I don't make these things to obvious to guess, just in case someone with less than honourable intentions wants to do something.
 
http://ukofequestria.co.uk - As per my profile and as SneakyDave worked-out!


Yep. Enquire via PM if you'd like to get involved and get the domain that bypasses the reverse proxy. I don't make these things to obvious to guess, just in case someone with less than honourable intentions wants to do something.

Your load times aren't great but they're hardly absurd on my end. You could do with a lot of server optimizations though.

Your cache headers are awful. You have a lot of static content with extremely low cache times set. See the list below:
Two hours is an inappropriately low cache time for static content. This is stuff that most people set their cache headers to 1 year + on and you've got them set to reload several times a day for regular visitors. I imagine as a MLP forum you end up with a lot of regular visitors and could reduce your server load if they were loading static content from cache instead of your server.

Here is a really basic nginx location block for static content:
Code:
location ~* \.(jpg|jpeg|gif|png|svg|css|js|ico|xml)$ {
    access_log        off;
    log_not_found     off;
    expires           max;
}

Serving your static content from Imgur is not a good idea. You have article image previews and some icons being served from imgur. Your site relies on the responsiveness of imgur. Imgur is not a CDN. It's an image sharing site. If you're using Cloudflare then you're actually bypassing your CDN by serving images from Imgur. If you'd served them locally then they'd be served from Cloudflare.

There's also something wrong with your Google Analytics code. It's failing even with my tracking block turned off and it is greatly increasing your reported page load time. This can make page load times look obscene in some browsers that wait for it. How are you implementing Analytics? I don't recommend using the built-in XenForo setting. Manually enter it into your footer template and update it as needed when changes are made to the Analytics API.
 
Weird... that message was supposed to be in a Private Conversation that I had going... don't know why it went here as it doesn't pertain to your questions. :confused:
 
Thanks very much for all the suggestions. The improvements suggested by the bench-markers are useful, albeit negligible compared to delay being caused by the web server.

So, I did a bit of diagnosing on the server, and just happened to come along with the idea of testing the I/O of the server. I have several containers on the particular provider I am using - they are all on different VPS Nodes.

Here's one result from one of my containers on one particular VPS Node:
Code:
# dd if=/dev/zero of=test bs=64k count=16k conv=fdatasync
16384+0 records in
16384+0 records out
1073741824 bytes (1.1 GB) copied, 15.5203 s, 69.2 MB/s

Okay, not particularly bad. Now try the same test on the production server for the website:
Code:
# dd if=/dev/zero of=test bs=64k count=16k conv=fdatasync
16384+0 records in
16384+0 records out
1073741824 bytes (1.1 GB) copied, 69.0494 s, 15.6 MB/s

Maybe it's just me, but the disk speed on the server doesn't really seem up to scratch. I have filed a ticket with the provider with these results, and it could indicate a problem with the Node's RAID, or some other utilisation issue.

Edit: Scratch that. Rebooted the VPS at 2:30 this morning and got this result...
Code:
# dd if=/dev/zero of=test bs=64k count=16k conv=fdatasync
16384+0 records in
16384+0 records out
1073741824 bytes (1.1 GB) copied, 9.69082 s, 111 MB/s

Unless another customer on the node is doing really stupid things at "peak" times, I really can't understand what the problem might be, other than a PHP-FPM or OS configuration issue. I am currently running this on CentOS 6. Could there be any benefit in trying with Debian or another OS?
 
Last edited:
Top Bottom