Huge page loading / server response time ( > 1.5 s) because of 1 AddOn

FloV

Well-known member
Hey everybody,

i need your help again! :) The page loading time of my site is really horrible. After playing around and a lot of debugging i've figured out that's because of 1 single AddOn.

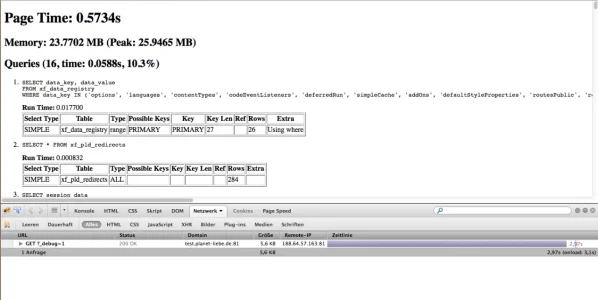
With the AddOn
Bildschirmfoto 2014-03-14 um 12.26.32.webp
Page Time: 0.5734s
Memory: 23.7702 MB (Peak: 25.9465 MB)
Queries (16, time: 0.0588s, 10.3%)


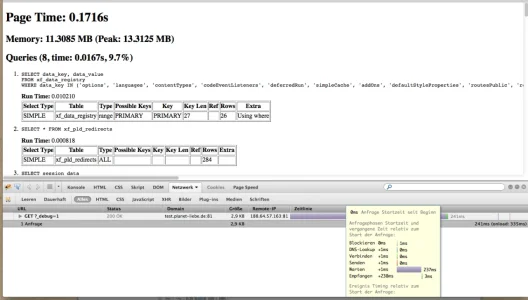
Without
Bildschirmfoto 2014-03-14 um 12.25.36.webp
Page Time: 0.1716s
Memory: 11.3085 MB (Peak: 13.3125 MB)
Queries (8, time: 0.0167s, 9.7%)


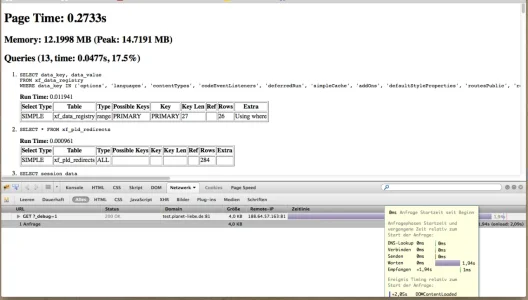
As you can see in the Screenshot, specially the server response time is with 2.5 seconds very high (with enabled AddOn). When the AddOn is disabled it's still not low but much (!) better.

So, it's a portal AddOn and the developer isn't around anymore. I have to use the AddOn to keep my site alive. Is there anything i can do to figure out what exactly is causing the problem?

It would be great if you could help me out with this, it's really anoying.

Thanks so far! :)

Florian
 
Those outputs suggest the difference in page time is around 0.4 seconds. That's not too bad...
 
It isn't the Xenforo as a while that is giving you trouble, but something else embedded in the page.

As @Chris D is telling you the diccerence in page (ie HTML) production is just of 0.4s, not to bad. Now I am sure that the addon is injecting some content into the page that needs to be loaded and THAT most probably is what is causing you trouble.

Open the graph bar at the bottoms and see what element(s) takes the most time loading, and you'll have found your culprit.
 
Hey,

thank you both for your answers! :)

Of course, the page loading time isn't that bad. It's the server response time that's bothering me.

Here is another screen i've just made.

Bildschirmfoto 2014-03-14 um 14.14.54.webp

The browser is waiting for an answer for 1.94 seconds, after it get's the response, that page is loading pretty fast (1ms). With the addon disabled, the response time is much better. The graph bar tells me, that 99% of the loading time is waiting.
 
It's like 8 more queries that the addon require to display he content. If you could read the code and try to refactor it to reduce the number of queries that could help you.
 
Hey,

thank you both for your answers! :)

Of course, the page loading time isn't that bad. It's the server response time that's bothering me.

Here is another screen i've just made.

View attachment 69552

The browser is waiting for an answer for 1.94 seconds, after it get's the response, that page is loading pretty fast (1ms). With the addon disabled, the response time is much better. The graph bar tells me, that 99% of the loading time is waiting.

Hey bud, in your attachment there next to GET ?_debug=1 you'll see the arrow to expand the loaded resources. If you expand that and then take a screen shot of that list we'll be able to tell you what resource is causing the slow response. Like they said, it's not the add-on doing it (not in the backend anyway), but instead a resource that the add-on is trying to load - maybe some external JS or external images.

Just get a screenshot of that expanded list and we'll be able to tell you.
 
Hey,

as far as i understand, there is nothing else loaded on that debug explanation page (?_debug=1). The page is only 5kb, there is no javascript etc. loaded, just the explanation of all the queries and includes.

If i click on the arrow next to ?_debug=1 you will just see some information about the header,...
 
I'm assuming the normal page without the ?_debug=1 loads slow as well though? I'm guessing the issue isn't isolated only to the debug page. Since the queries and PHP processing time aren't causing the slow page load (your screenshot shows all that is done in a .27 seconds) that means there is another resource causing the delay. Seeing that expanded list on a non-debug page will show you exactly how long each resource took to load.

Please remember though that usually when you have the console / Firebug open it disables the cache so the load will already be slower.
 
Ok, now it's a little bit clearer.

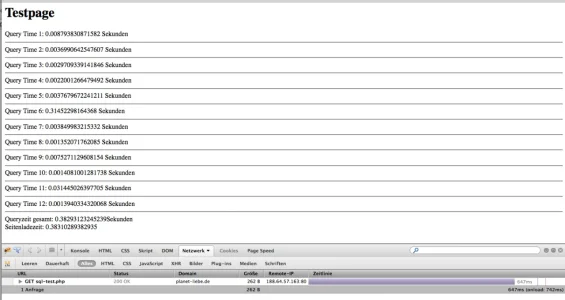
I've created a new php file with the following content:

Code:
<?php
ini_set('memory_limit', '512M');

error_reporting(E_ALL);

$startTime = microtime(true);
$fileDir = dirname(__FILE__)."/../";

require($fileDir . 'library/XenForo/Autoloader.php');

XenForo_Autoloader::getInstance()->setupAutoloader($fileDir . '/library');
XenForo_Application::initialize($fileDir . '/library', $fileDir);
XenForo_Application::set('page_start_time', $startTime);

$db = XenForo_Application::get('db');

...

Code:
$queryTime = $executionTime12 + $executionTime11 + $executionTime10 + $executionTime9 + $executionTime8 + $executionTime7 + $executionTime6 + $executionTime5 + $executionTime4 + $executionTime3 + $executionTime2 + $executionTime1;

echo "Queryzeit gesamt: " . $queryTime . "Sekunden<br />";

$endTime = microtime(true);
$loadTime = $endTime - $startTime;
echo "Pageload: " . $loadTime;
?>

In the middle of that php file i've placed the 12 SELECT queries that are executed on the forum start page.

You can run that file over here: http://www.planet-liebe.de/development/sql-test.php

The result: Query 6 is is by far the slowest query. The query looks like this:

SELECT session_activity.* , user.*, user_profile.*, user_option.*
FROM xf_session_activity AS session_activity
LEFT JOIN xf_user AS user ON (user.user_id = session_activity.user_id)
LEFT JOIN xf_user_profile AS user_profile ON (user_profile.user_id = user.user_id)
LEFT JOIN xf_user_option AS user_option ON (user_option.user_id = user.user_id)
WHERE (session_activity.view_date > 1395220990)
ORDER BY session_activity.view_date DESC

My firebug says that page is loading in 647ms, the page itself says it took 383ms to load.

Bildschirmfoto 2014-03-19 um 14.29.18.webp

My question is, why is there a difference of almost 300ms between the Firebug and the actually pageload time and why is the firebug saying it took 646ms to wait.

Since there are only 12 queries on that page and really nothing else is loaded (no style, no javascript, no graphics,....) maybe there is something wrong with my database connection / config? I mean 647ms (or 383ms) for that page is way to high, isn't it?
 
Top Bottom