thousands of errors in one moment

craigiri

Well-known member
The errors seem to happen on some kind of a schedule. That is, hundreds or thousands will happen at 8:20 PM, etc. - meaning it's probably a cron job or scheduled item which causes them???

There are two errors:
Code:
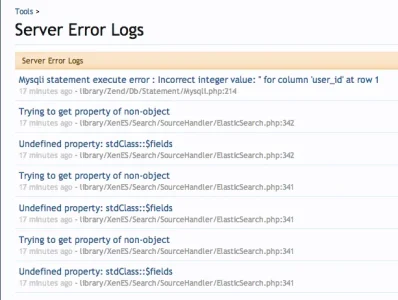
ErrorException: Trying to get property of non-object - library/XenES/Search/SourceHandler/ElasticSearch.php:342
Generated By: Unknown Account, Sunday at 1:27 PM

and

ErrorException: Undefined property: stdClass::$fields - library/XenES/Search/SourceHandler/ElasticSearch.php:342
Generated By: Unknown Account, Sunday at 1:27 PM

NOTE: There are 8,000 errors of this type generated in two times - last Sunday at 1:27 PM and yesterday at 8:20 PM

Search seems to work fine.

Is this something on the server that needs fixed? Should I re-index or do something else with ES?
 
Last edited:
They seem to be triggered by a simple (or random) search....
Code:
Request State
array(3) {
  ["url"] => string(40) "http://www.hearth.com/talk/search/search"
  ["_GET"] => array(0) {
  }
  ["_POST"] => array(13) {
    ["keywords"] => string(13) "shifted liner"
    ["users"] => string(0) ""
    ["date"] => string(0) ""
    ["reply_count"] => string(1) "0"
    ["prefixes"] => array(1) {
      [0] => string(0) ""
    }
    ["nodes"] => array(1) {
      [0] => string(0) ""
    }
    ["child_nodes"] => string(1) "1"
    ["order"] => string(7) "replies"
    ["type"] => string(4) "post"
    ["_xfToken"] => string(8) "********"
    ["_xfRequestUri"] => string(23) "/talk/search/?type=post"
    ["_xfNoRedirect"] => string(1) "1"
    ["_xfResponseType"] => string(4) "json"
  }
}
 
It sounds like it's just the same thing over and over. This is probably all logged in one request as most of those look like notices.

However, can you go back to the very first error record that seems to be generated from this request. Is it different?

This seems to be implying that the data returned from ElasticSearch is "valid" in terms of being an array, but is not the expected structure.
 
No reports of any problem from users - and both requests which tripped it seem like regular searches....

Yes, it seems to have been tripped by you - 3 errors now, the other two and this
Code:
Zend_Db_Statement_Mysqli_Exception: Mysqli statement execute error : Incorrect integer value: '' for column 'user_id' at row 1 - library/Zend/Db/Statement/Mysqli.php:214
Generated By: Unknown Account, 15 minutes ago

Main point is that this did not happen for the first 3 weeks after I upgraded to 1.2.1 - so I can't blame it on that.

XF ES 1.02

Server ES seems to be 0.18.7 - same as originally installed 2+ years ago...
 

Attachments

  • Screen Shot 2013-09-25 at 9.24.15 AM.webp
    Screen Shot 2013-09-25 at 9.24.15 AM.webp
    35.6 KB · Views: 2
What's the back trace on that DB error?

I don't see why this would happen, but I'd need to see the actual ES output. It's clearly putting out something that's right but then part of the data is wrong/different than we expect.
 
Code:
Error Info
Zend_Db_Statement_Mysqli_Exception: Mysqli statement execute error : Incorrect integer value: '' for column 'user_id' at row 1 - library/Zend/Db/Statement/Mysqli.php:214
Generated By: Unknown Account, 56 minutes ago
Stack Trace
#0 /usr/local/www/htdocs/talk/library/Zend/Db/Statement.php(297): Zend_Db_Statement_Mysqli->_execute(Array)
#1 /usr/local/www/htdocs/talk/library/Zend/Db/Adapter/Abstract.php(479): Zend_Db_Statement->execute(Array)
#2 /usr/local/www/htdocs/talk/library/XenES/Search/SourceHandler/ElasticSearch.php(358): Zend_Db_Adapter_Abstract->query('?????INSERT INT...')
#3 /usr/local/www/htdocs/talk/library/XenES/Search/SourceHandler/ElasticSearch.php(238): XenES_Search_SourceHandler_ElasticSearch->_getSqlLimitedHits(Array, Array, Array, Array, 200, Object(XenForo_Search_DataHandler_Post))
#4 /usr/local/www/htdocs/talk/library/XenForo/Search/SourceHandler/Abstract.php(152): XenES_Search_SourceHandler_ElasticSearch->executeSearch('shifted liner', false, Array, Array, '', '200', Object(XenForo_Search_DataHandler_Post))
#5 /usr/local/www/htdocs/talk/library/XenForo/Search/Searcher.php(111): XenForo_Search_SourceHandler_Abstract->searchType(Object(XenForo_Search_DataHandler_Post), 'shifted liner', Array, 'replies', 0, '200')
#6 /usr/local/www/htdocs/talk/library/XenForo/ControllerPublic/Search.php(224): XenForo_Search_Searcher->searchType(Object(XenForo_Search_DataHandler_Post), 'shifted liner', Array, 'replies', 0)
#7 /usr/local/www/htdocs/talk/library/XenForo/FrontController.php(337): XenForo_ControllerPublic_Search->actionSearch()
#8 /usr/local/www/htdocs/talk/library/XenForo/FrontController.php(134): XenForo_FrontController->dispatch(Object(XenForo_RouteMatch))
#9 /usr/local/www/htdocs/talk/index.php(13): XenForo_FrontController->run()
#10 {main}
Request State
array(3) {
  ["url"] => string(40) "http://www.hearth.com/talk/search/search"
  ["_GET"] => array(0) {
  }
  ["_POST"] => array(13) {
    ["keywords"] => string(13) "shifted liner"
    ["users"] => string(0) ""
    ["date"] => string(0) ""
    ["reply_count"] => string(1) "0"
    ["prefixes"] => array(1) {
      [0] => string(0) ""
    }
    ["nodes"] => array(1) {
      [0] => string(0) ""
    }
    ["child_nodes"] => string(1) "1"
    ["order"] => string(7) "replies"
    ["type"] => string(4) "post"
    ["_xfToken"] => string(8) "********"
    ["_xfRequestUri"] => string(23) "/talk/search/?type=post"
    ["_xfNoRedirect"] => string(1) "1"
    ["_xfResponseType"] => string(4) "json"
  }
}
Delete...Close
 
Right, looking in more detail, I think I see what's happening. Try going to the "Elasticsearch Setup" page in the control panel (under Tools) and delete the index. After you do that, re-set the analyzer if you had something other than standard selected. Then rebuild the index. Hopefully that should fix it.
 
We have seen this a few times, although it is by no means common.

Latest event resulted in around 1000 errors in the log and was another one off.

@Mike I have the error log still and haven't rebuilt anything if you require any further info to help?

For info XF 1.3.1 ES, XFES 1.0.3,
Elasticsearch Version: 0.20.5
Standard Analyzer
 
I don't have any particular recollection of what I thought this issue was. Deleting the index and rebuilding it should ensure that the correct data/structure is stored though.
 
It seems to be a transient thing - if I do a search with the terms listed in the error, I don't see any problems, and whilst the one user/search results in thousands of errors over a second or so, we don't see any more from other users or any more from that user.

I will rebuild the index anyway as it won't do any harm, but won't be surprised if the error crops up again in another month or so.
 
Rebuilding now, but just re-reading above and looking at my error messages

["order"] => string(7) "replies"


I guess that indicates order by number of replies and is probably relevant! I didn't order by replies when I tried to reproduce things and I would guess that the majority of people searching don't do that either.
 
Yeah, that is relevant as this only happens when there is a second level of filtering applied. Let me know if you can still reproduce it after rebuilding. I would need FTP access to attempt to debug it.
 
Top Bottom