Site being very slow, too many queries, High load times!

faeronsayn

Well-known member
Page Time: 6.4313s

Memory: 14.3228 MB (Peak: 17.4902 MB)

Queries (32, time: 3.2619s, 50.7%)


Those are the load times I am getting when I go into debug.

I am pretty sure that these are high, even for my site. I only get about 100 people on simultaneously, no more than that. I do have a several addons installed, but I am not so sure if that is the problem or not. If anyone can help optimize this or at least let me know where I could go about optimizing it, would be really appreciated. Thank you :)

Edit: More infromation

At the time of this screenshot I have the following members online: Online now: 157 (members: 30, guests: 127)

Caasdfasdfasdfpture.PNG


Processes Running


Code:
  PID TTY          TIME CMD
    1 ?        00:00:00 init
    2 ?        00:00:00 kthreadd
    3 ?        00:00:00 migration/0
    4 ?        00:00:00 ksoftirqd/0
    5 ?        00:00:00 migration/0
    6 ?        00:00:00 watchdog/0
    7 ?        00:00:00 migration/1
    8 ?        00:00:00 migration/1
    9 ?        00:00:00 ksoftirqd/1
  10 ?        00:00:00 watchdog/1
  11 ?        00:00:00 migration/2
  12 ?        00:00:00 migration/2
  13 ?        00:00:00 ksoftirqd/2
  14 ?        00:00:00 watchdog/2
  15 ?        00:00:00 migration/3
  16 ?        00:00:00 migration/3
  17 ?        00:00:00 ksoftirqd/3
  18 ?        00:00:00 watchdog/3
  19 ?        00:00:00 events/0
  20 ?        00:00:00 events/1
  21 ?        00:00:00 events/2
  22 ?        00:00:00 events/3
  23 ?        00:00:00 cpuset
  24 ?        00:00:00 khelper
  25 ?        00:00:00 netns
  26 ?        00:00:00 async/mgr
  27 ?        00:00:00 pm
  28 ?        00:00:00 xenwatch
  29 ?        00:00:00 xenbus
  30 ?        00:00:00 sync_supers
  31 ?        00:00:00 bdi-default
  32 ?        00:00:00 kintegrityd/0
  33 ?        00:00:00 kintegrityd/1
  34 ?        00:00:00 kintegrityd/2
  35 ?        00:00:00 kintegrityd/3
  36 ?        00:00:00 kblockd/0
  37 ?        00:00:00 kblockd/1
  38 ?        00:00:00 kblockd/2
  39 ?        00:00:00 kblockd/3
  40 ?        00:00:00 ata/0
  41 ?        00:00:00 ata/1
  42 ?        00:00:00 ata/2
  43 ?        00:00:00 ata/3
  44 ?        00:00:00 ata_aux
  45 ?        00:00:00 ksuspend_usbd
  46 ?        00:00:00 khubd
  47 ?        00:00:00 kseriod
  48 ?        00:00:00 md/0
  49 ?        00:00:00 md/1
  50 ?        00:00:00 md/2
  51 ?        00:00:00 md/3
  52 ?        00:00:00 md_misc/0
  53 ?        00:00:00 md_misc/1
  54 ?        00:00:00 md_misc/2
  55 ?        00:00:00 md_misc/3
  56 ?        00:00:00 khungtaskd
  57 ?        00:00:01 kswapd0
  58 ?        00:00:00 ksmd
  59 ?        00:00:00 aio/0
  60 ?        00:00:00 aio/1
  61 ?        00:00:00 aio/2
  62 ?        00:00:00 aio/3
  63 ?        00:00:00 crypto/0
  64 ?        00:00:00 crypto/1
  65 ?        00:00:00 crypto/2
  66 ?        00:00:00 crypto/3
  71 ?        00:00:00 kthrotld/0
  72 ?        00:00:00 kthrotld/1
  73 ?        00:00:00 kthrotld/2
  74 ?        00:00:00 kthrotld/3
  76 ?        00:00:00 khvcd
  77 ?        00:00:00 kpsmoused
  78 ?        00:00:00 usbhid_resumer
  219 ?        00:00:03 kjournald
  285 ?        00:00:00 udevd
  518 ?        00:00:00 kstriped
  610 ?        00:00:07 flush-202:1
  629 ?        00:00:00 kauditd
  836 ?        00:00:00 auditd
  852 ?        00:00:01 rsyslogd
  904 ?        00:00:00 sw-cp-serverd
  914 ?        00:00:00 sshd
  922 ?        00:00:00 xinetd
  935 ?        00:00:00 couriertcpd
  937 ?        00:00:00 courierlogger
  945 ?        00:00:00 couriertcpd
  947 ?        00:00:00 courierlogger
  953 ?        00:00:00 couriertcpd
  955 ?        00:00:00 courierlogger
  962 ?        00:00:00 couriertcpd
  964 ?        00:00:00 courierlogger
1044 ?        00:00:00 master
1055 ?        00:00:00 qmgr
1059 ?        00:00:00 psa-pc-remote
1076 ?        00:00:00 tlsmgr
1130 ?        00:00:01 named
1171 ?        00:00:00 mysqld_safe
1263 ?        00:09:21 mysqld
1524 ?        00:01:00 drwebd.real
1534 ?        00:00:00 crond
1549 tty1    00:00:00 mingetty
1551 tty2    00:00:00 mingetty
1553 tty3    00:00:00 mingetty
1555 tty4    00:00:00 mingetty
1557 tty5    00:00:00 mingetty
1559 tty6    00:00:00 mingetty
1562 ?        00:00:00 udevd
1563 ?        00:00:00 udevd
1564 hvc0    00:00:00 agetty
4715 ?        00:00:01 httpd
4717 ?        00:00:00 httpd
5054 ?        00:00:00 sshd
5071 ?        00:00:00 sftp-server
19118 ?        00:00:00 pickup
23333 ?        00:02:53 httpd
25819 ?        00:02:07 httpd
26920 ?        00:01:55 httpd
26929 ?        00:01:45 httpd
27852 ?        00:01:27 httpd
28047 ?        00:01:27 httpd
28543 ?        00:01:28 httpd
29413 ?        00:00:46 httpd
29456 ?        00:01:03 httpd
29463 ?        00:01:13 httpd
29838 ?        00:00:53 httpd
30270 ?        00:00:47 httpd
30289 ?        00:00:44 httpd
30310 ?        00:00:51 httpd
30420 ?        00:00:46 httpd
30591 ?        00:00:48 httpd
30939 ?        00:00:31 httpd
31003 ?        00:00:00 sshd
31028 pts/0    00:00:00 bash
31054 pts/0    00:00:00 top
31305 ?        00:00:28 httpd
31519 ?        00:00:00 drwebd.real
31520 ?        00:00:00 drwebd.real
31521 ?        00:00:00 drwebd.real
31523 ?        00:00:00 drwebd.real
31673 ?        00:00:16 httpd
31674 ?        00:00:22 httpd
32050 ?        00:00:10 httpd
32498 pts/0    00:00:00 ps
 
That's many more queries than I see on my pages - but it still should not make a big difference. My old forum often used 30-50 queries per page!

My guess is that you are on a shared server and the problem is elsewhere. Have you done a top command (unix) to see how busy the actual server is?
 
Windows or Linux server?
RAM?
Basic hosting, VPS, Shared or Dedicated server?
Any other sites or applications on the same server?
If you can find it/know what it is - can you post a copy of your my.cnf MySQL configuration file?

Cheers,
Shaun :D
 
Windows or Linux server?
RAM?
Basic hosting, VPS, Shared or Dedicated server?
Any other sites or applications on the same server?
If you can find it/know what it is - can you post a copy of your my.cnf MySQL configuration file?

Cheers,
Shaun :D

Okay well I am using a VPS server. It has 2gigs of ram, I am currently running Plesk 10 on it. This is a Linux server running CentOS. Also I do not know where the my.cnf file is but if you could give me the location I'll post it here. I am also not running any other applications on the vps besides the actual website, and centos/plesk.

That's many more queries than I see on my pages - but it still should not make a big difference. My old forum often used 30-50 queries per page!

My guess is that you are on a shared server and the problem is elsewhere. Have you done a top command (unix) to see how busy the actual server is?

Could you tell me how to do this command, so I can check how busy my VPS really is. By the way, I am not on shared hosting, I am running a VPS with 2 gigs of ram.
 
What add-ons do you have installed?

Code:
Automatic Mobile Style Switcher 0.1
Delete...
Controls

AzuCloud 0.1.2
Delete...
Controls

CCPLZ Hide Links From Guests 1.0.0
Delete...
Controls

Custom BBCode Manager v1.2.1
Delete...
Controls

Display Staff Members 1.1.2
Delete...
Controls

ForumRunner for XenForo 1.1.0
Delete...
Controls

Hide Ip of Super Admin 1.0
Delete...
Controls

Likes Review 1.0.0
Delete...
Controls

Live Updates 2.0
Delete...
Controls

No Proxy Allowed 1.0
Delete...
Controls

Nodes As Tabs 1.1.0
Delete...
Controls

Online Status 1.1
Delete...
Controls

ragtek First Post Moderated 1.0.0
Delete...
Controls

ragtek [Planet Liebe] Automatic URL Aliases - Automatic URL conversion 1.2.3
Delete...
Controls

Simple Sitemap 1.02
Delete...
Controls

TaigaChat 0.5.5
Delete...
Controls

The Happy Place 3.0.0
Delete...
Controls

****** - Advanced Forum Statistics 0.9.1
Delete...
Controls

XenForo Enhanced Search 1.0.0
Delete...
Controls

XenQuotation 0.2.3
Delete...
Controls

XenTrader 2.0.3
Delete...
Controls

XF Arcade 0.0.8
Delete...
Controls

XFA - Previous and Next thread link 1.0.0
Delete...
Controls

[8wayRun.Com] XenPorta (Portal) 1.5.1
Delete...
Controls

[bd] Banking 0.9.9.1
Delete...
Controls

[bd] Forum Watch 0.9.6
Delete...
Controls

[bd] Tag Me 1.5.5
Delete...
Controls

[tLk] ReadPC 1.1.0
Delete...
Controls

[******] - Tags 1.0.0
Delete...
Controls

[******] Custom Node Icon 0.9
Delete...
Controls

[xfr] Merge Double User Post 1.2.0
 
Well, my assumption is that if you have a true VPS, the server load should be extremely low when you have only a few users on XF. The errors you are getting with your db connections (from your other thread) show that something is configured wrongly.

To do a "top" command, you need access to a command line interface. I would assume most VPS servers have this? 2 Gigs of RAM should be plenty for what you are doing. A stock mysql install should also do the job. I suspect your hosts are going to have to change something in the mysql config or elsewhere.

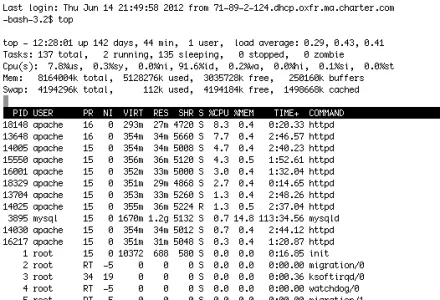
A "top" screen is enclosed - showing my server load at almost nothing (below 1) and the CPU at 90% idle - and also that the main programs running are apache and mysql.

Realistically, my first move if I were you would be to place a call or email into your hosts and show them that server log from other post and indicate that your mysql installation is not processing without errors.

Screen Shot 2012-06-15 at 12.27.51 PM.webp
 
This:


Has been known to drastically increase number of queries.

Disable this. Now how many queries?

EDIT: This is a suitable replacement for that add-on, should it be found to be causing the problem: http://xenforo.com/community/resources/tinhte-xentag.770/

I have it currently disabled, would removing it make the difference ?

Well, my assumption is that if you have a true VPS, the server load should be extremely low when you have only a few users on XF. The errors you are getting with your db connections (from your other thread) show that something is configured wrongly.

To do a "top" command, you need access to a command line interface. I would assume most VPS servers have this? 2 Gigs of RAM should be plenty for what you are doing. A stock mysql install should also do the job. I suspect your hosts are going to have to change something in the mysql config or elsewhere.

A "top" screen is enclosed - showing my server load at almost nothing (below 1) and the CPU at 90% idle - and also that the main programs running are apache and mysql.

Realistically, my first move if I were you would be to place a call or email into your hosts and show them that server log from other post and indicate that your mysql installation is not processing without errors.

View attachment 30579

Well I have installed everything my self onto the server, I am assuming that could be the bigger problem. All I simply did was use SolusVM to install CentOS 6.2 and then installed Plesk 10 through putty.

As for if I have access to a command line interface, I am assuming Putty should do the trick, which I indeed do have access to. If you could tell me the command I should run to display the data in your screenshot that would be great.
 
BTW I am running Plesk 10.

Thanks for the command ....

So here is the screenshot of my server with the "top" command.

capturasdfasdfe.png


I don't know if this helps but here is all the processes running....

Code:
  PID TTY          TIME CMD
    1 ?        00:00:00 init
    2 ?        00:00:00 kthreadd
    3 ?        00:00:00 migration/0
    4 ?        00:00:00 ksoftirqd/0
    5 ?        00:00:00 migration/0
    6 ?        00:00:00 watchdog/0
    7 ?        00:00:00 migration/1
    8 ?        00:00:00 migration/1
    9 ?        00:00:00 ksoftirqd/1
  10 ?        00:00:00 watchdog/1
  11 ?        00:00:00 migration/2
  12 ?        00:00:00 migration/2
  13 ?        00:00:00 ksoftirqd/2
  14 ?        00:00:00 watchdog/2
  15 ?        00:00:00 migration/3
  16 ?        00:00:00 migration/3
  17 ?        00:00:00 ksoftirqd/3
  18 ?        00:00:00 watchdog/3
  19 ?        00:00:00 events/0
  20 ?        00:00:00 events/1
  21 ?        00:00:00 events/2
  22 ?        00:00:00 events/3
  23 ?        00:00:00 cpuset
  24 ?        00:00:00 khelper
  25 ?        00:00:00 netns
  26 ?        00:00:00 async/mgr
  27 ?        00:00:00 pm
  28 ?        00:00:00 xenwatch
  29 ?        00:00:00 xenbus
  30 ?        00:00:00 sync_supers
  31 ?        00:00:00 bdi-default
  32 ?        00:00:00 kintegrityd/0
  33 ?        00:00:00 kintegrityd/1
  34 ?        00:00:00 kintegrityd/2
  35 ?        00:00:00 kintegrityd/3
  36 ?        00:00:00 kblockd/0
  37 ?        00:00:00 kblockd/1
  38 ?        00:00:00 kblockd/2
  39 ?        00:00:00 kblockd/3
  40 ?        00:00:00 ata/0
  41 ?        00:00:00 ata/1
  42 ?        00:00:00 ata/2
  43 ?        00:00:00 ata/3
  44 ?        00:00:00 ata_aux
  45 ?        00:00:00 ksuspend_usbd
  46 ?        00:00:00 khubd
  47 ?        00:00:00 kseriod
  48 ?        00:00:00 md/0
  49 ?        00:00:00 md/1
  50 ?        00:00:00 md/2
  51 ?        00:00:00 md/3
  52 ?        00:00:00 md_misc/0
  53 ?        00:00:00 md_misc/1
  54 ?        00:00:00 md_misc/2
  55 ?        00:00:00 md_misc/3
  56 ?        00:00:00 khungtaskd
  57 ?        00:00:01 kswapd0
  58 ?        00:00:00 ksmd
  59 ?        00:00:00 aio/0
  60 ?        00:00:00 aio/1
  61 ?        00:00:00 aio/2
  62 ?        00:00:00 aio/3
  63 ?        00:00:00 crypto/0
  64 ?        00:00:00 crypto/1
  65 ?        00:00:00 crypto/2
  66 ?        00:00:00 crypto/3
  71 ?        00:00:00 kthrotld/0
  72 ?        00:00:00 kthrotld/1
  73 ?        00:00:00 kthrotld/2
  74 ?        00:00:00 kthrotld/3
  76 ?        00:00:00 khvcd
  77 ?        00:00:00 kpsmoused
  78 ?        00:00:00 usbhid_resumer
  219 ?        00:00:03 kjournald
  285 ?        00:00:00 udevd
  518 ?        00:00:00 kstriped
  610 ?        00:00:07 flush-202:1
  629 ?        00:00:00 kauditd
  836 ?        00:00:00 auditd
  852 ?        00:00:01 rsyslogd
  904 ?        00:00:00 sw-cp-serverd
  914 ?        00:00:00 sshd
  922 ?        00:00:00 xinetd
  935 ?        00:00:00 couriertcpd
  937 ?        00:00:00 courierlogger
  945 ?        00:00:00 couriertcpd
  947 ?        00:00:00 courierlogger
  953 ?        00:00:00 couriertcpd
  955 ?        00:00:00 courierlogger
  962 ?        00:00:00 couriertcpd
  964 ?        00:00:00 courierlogger
1044 ?        00:00:00 master
1055 ?        00:00:00 qmgr
1059 ?        00:00:00 psa-pc-remote
1076 ?        00:00:00 tlsmgr
1130 ?        00:00:01 named
1171 ?        00:00:00 mysqld_safe
1263 ?        00:09:21 mysqld
1524 ?        00:01:00 drwebd.real
1534 ?        00:00:00 crond
1549 tty1    00:00:00 mingetty
1551 tty2    00:00:00 mingetty
1553 tty3    00:00:00 mingetty
1555 tty4    00:00:00 mingetty
1557 tty5    00:00:00 mingetty
1559 tty6    00:00:00 mingetty
1562 ?        00:00:00 udevd
1563 ?        00:00:00 udevd
1564 hvc0    00:00:00 agetty
4715 ?        00:00:01 httpd
4717 ?        00:00:00 httpd
5054 ?        00:00:00 sshd
5071 ?        00:00:00 sftp-server
19118 ?        00:00:00 pickup
23333 ?        00:02:53 httpd
25819 ?        00:02:07 httpd
26920 ?        00:01:55 httpd
26929 ?        00:01:45 httpd
27852 ?        00:01:27 httpd
28047 ?        00:01:27 httpd
28543 ?        00:01:28 httpd
29413 ?        00:00:46 httpd
29456 ?        00:01:03 httpd
29463 ?        00:01:13 httpd
29838 ?        00:00:53 httpd
30270 ?        00:00:47 httpd
30289 ?        00:00:44 httpd
30310 ?        00:00:51 httpd
30420 ?        00:00:46 httpd
30591 ?        00:00:48 httpd
30939 ?        00:00:31 httpd
31003 ?        00:00:00 sshd
31028 pts/0    00:00:00 bash
31054 pts/0    00:00:00 top
31305 ?        00:00:28 httpd
31519 ?        00:00:00 drwebd.real
31520 ?        00:00:00 drwebd.real
31521 ?        00:00:00 drwebd.real
31523 ?        00:00:00 drwebd.real
31673 ?        00:00:16 httpd
31674 ?        00:00:22 httpd
32050 ?        00:00:10 httpd
32498 pts/0    00:00:00 ps
 
How many CPU cores do you have access to? If you press 1 while running top, it will show each CPU individually.

That loads could be considered high, but really depends on the CPUs. How many members were online at the time?
 
Oh just to clarify this is a XEN Virtualized VPS if that makes any difference.

How many CPU cores do you have access to? If you press 1 while running top, it will show each CPU individually.

That loads could be considered high, but really depends on the CPUs. How many members were online at the time?

I have access to 4 I am assuming since I just ran the command that you were talking about and it came up with four. Here is the new screen shot with the 1 being pressed.

At the time of this screenshot I have the following members online: Online now: 157 (members: 30, guests: 127)

Caasdfasdfasdfpture.PNG
 
Firstly, enabling debugging will drasticly increase your load.

I would suggest disabling all addons, to start with, add this to your config and see what the loads and queries come down to.

Code:
$config['enableListeners'] = 0;
Do you have any caching mechanism installed such as APC or memcached. Are you using the minify option?

Currently no I have disabled / removed them since I came to the new server none of them are installed.

Although I do have the front end caching in my Config file... this thing
Code:
$config['cache']['enabled'] = true;
$config['cache']['frontend'] = 'Core';
$config['cache']['frontendOptions'] = array(
'caching'                   => true,
'automatic_serialization'   => true,
'lifetime'                  => 3600,
'cache_id_prefix'           => 'xf_'
);

Okay I disabled all addons through that command in my config file and I have approximately 11 database queries now.

Page Time: 2.0806s

Memory: 10.0887 MB (Peak: 13.0035 MB)

Queries (11, time: 0.0281s, 1.4%)


That is what I am getting with all the addons turned off.
 
It would suggest your problem is with one of your addons then.

Disable them all in admin cp and start re-enabling them one at a time to find out which ones are cauing the most problems.

Also installing apc and memcached will help reduce the loads.
 
also in Admin CP > options > performance, do you have minify enabled?


Uhm I think I have a problem here

What do you do when something like this happens

Caasdfasdfptuasdfre.PNG


Just look at the loads, that completely crazy.

and my site now displays

Code:
An exception occurred: Too many connections in /var/www/vhosts/domainnamehere.com/httpdocs/library/Zend/Db/Adapter/Mysqli.php on line 333
[LIST=1]
[*]Zend_Db_Adapter_Mysqli->_connect() in Zend/Db/Adapter/Abstract.php at line 315
[*]Zend_Db_Adapter_Abstract->getConnection() in XenForo/Application.php at line 553
[*]XenForo_Application->loadDb()
[*]call_user_func_array() in XenForo/Application.php at line 780
[*]XenForo_Application->lazyLoad() in XenForo/Application.php at line 810
[*]XenForo_Application::get() in XenForo/Application.php at line 1099
[*]XenForo_Application::getDb() in XenForo/Error.php at line 47
[*]XenForo_Error::unexpectedException() in XenForo/Application.php at line 295
[*]XenForo_Application::handleException()
[/LIST]
Could my site be under attack or what could lead my server to have such load averages?
 
Back
Top Bottom