You're welcome! Thanks so much for the quick patch. I will let you know how it works!Thank you for the report. This should be fixed in the latest release.
You are using an out of date browser. It may not display this or other websites correctly.
You should upgrade or use an alternative browser.
You should upgrade or use an alternative browser.
[AddonsLab] Unread Post Count 1.6.0
No permission to download
- Thread starter AddonsLab
- Start date
@AddonsLab I've been running 1.4.4 for a bit and have noticed that my server load has been slowly increasing. Lately it's gotten well out of hand, when I look at TOP I've noticed my %CPU for MYSQLD has is running in around 125-500 %CPU.
I've disabled all my add-ons and the load went way down. MYSQLD is now only at 6.6 %CPU.
Long story short I've narrowed it down to this add-on. I've just updated to the latest version (1.5.1) and have re-enabled the add-on. As soon as I do the MYSQLD immediately jumps up to 125+ %CPU.
I disable the add-on and it then dives down to 5-10 %CPU.
The forum has just over 30,000 members with 700,000+ posts.
It is best to keep this forum disabled on bigger forums or is there something I can do to improve the performance?
@AddonsLab I've been running 1.4.4 for a bit and have noticed that my server load has been slowly increasing. Lately it's gotten well out of hand, when I look at TOP I've noticed my %CPU for MYSQLD has is running in around 125-500 %CPU.
I've disabled all my add-ons and the load went way down. MYSQLD is now only at 6.6 %CPU.
Long story short I've narrowed it down to this add-on. I've just updated to the latest version (1.5.1) and have re-enabled the add-on. As soon as I do the MYSQLD immediately jumps up to 125+ %CPU.
I disable the add-on and it then dives down to 5-10 %CPU.
The forum has just over 30,000 members with 700,000+ posts.
It is best to keep this forum disabled on bigger forums or is there something I can do to improve the performance?
I am afraid the only optimization mechanism available is the option to cache the unread post count. The higher the cache TTL fewer SQL queries will be made. Please check what's the value you use now and see if tweaking the value decreases the server load.
Thank you!
It is best to keep this forum disabled on bigger forums or is there something I can do to improve the performance?
I have a 2min cache, and 2.9mil posts with avg 500 new posts/day, and don't experience any SQL issue similar to what you describe (last 12 hr stats from my MySQL server below). You might need to detail your server environment deeper, and inspect mysql activity to see what is causing the load.option to cache the unread post count.
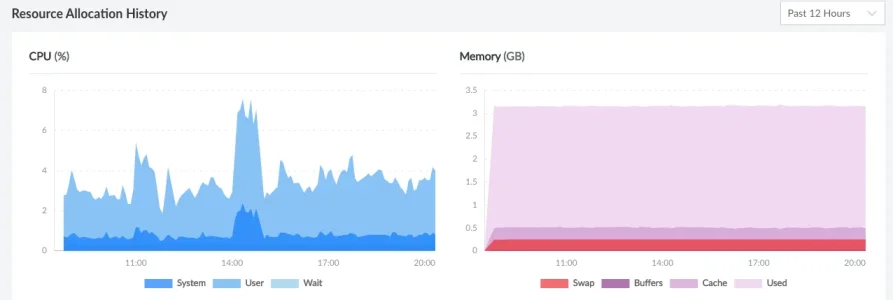
Last edited:
I am afraid the only optimization mechanism available is the option to cache the unread post count. The higher the cache TTL fewer SQL queries will be made. Please check what's the value you use now and see if tweaking the value decreases the server load.
Thank you!
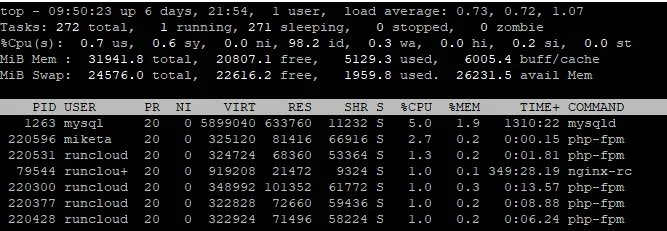
After re-enabling the add-on I found the cache was set to 1 minute. Setting to 2 minutes was better as I wasn't seeing 500%CPU for mysqld, but still rather high at 138%CPU:

Disabling the addon and waiting a few minutes the server load looks like so:
I have a 2min cache, and 2.9mil posts with avg 500 new posts/day, and don't experience any SQL issue similar to what you describe (last 12 hr stats from my MySQL server below). You might need to detail your server environment deeper, and inspect mysql activity to see what is causing the load.
View attachment 265958
Well I'm certainly no developer or a database guru, but it's certainly something related to this add-on. I've left the add-on disabled since creating the post and then briefly re-enabled it, disabled it again, and then let it run again for a short time this morning and the server load looks like so:
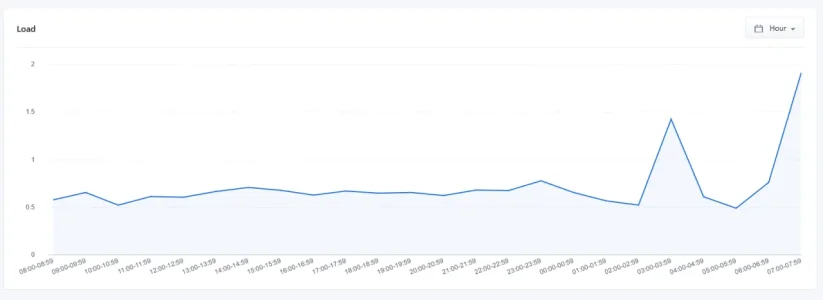
I've even tried disabling every add-on and only enabling this particular add-on and while that certainly helped, but load would still be high. MYSQLD would show a 60-100%CPU usage in TOP.
So maybe a conflict with another addon causing the big spikes, but this addon and this addon alone still caused higher work loads.
The interesting part is I've been running this addon for years, since it came out for XF 1.5 on other forums without any more issues like this one.
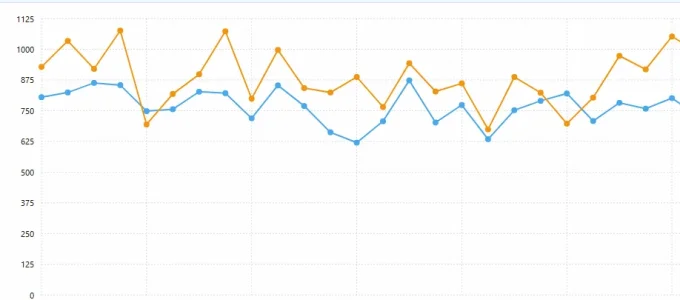
But this site is also my busiest site compared to others. Averaging around 700+ posts a day:
I've re-enabled the plugin and this time set the cache time from 2 minutes to 4 minutes. I've also set "Read marking data lifetime" from 24 days down to 1 day for a bit (my thinking is making eveything set to "read", maybe it did nothing) then to 21 days.
So read marking data lifetime is now 21 days, and unread post count cache is set to 4 minutes.
This has been a huge improvement. mysqld now shows on average of 8-12% CPU. With a few minor spikes like so:
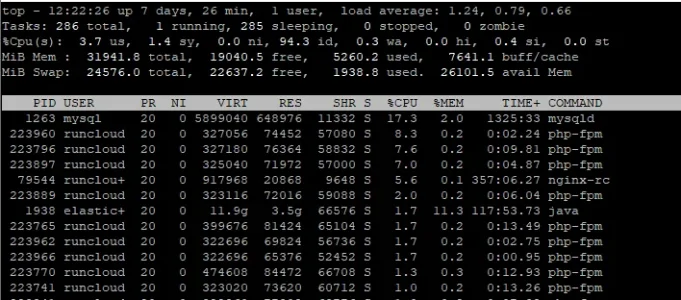
But at least everything appears to be back to normal for the time being.
So read marking data lifetime is now 21 days, and unread post count cache is set to 4 minutes.
This has been a huge improvement. mysqld now shows on average of 8-12% CPU. With a few minor spikes like so:

But at least everything appears to be back to normal for the time being.
Hello,
A customer of mine which has a big board (180k threads / 2.5M posts / hundred of nodes) was experiencing issues too with load times of 3s for the page, every times the cache updates.
I removed the following bit from the query:
This would indeed be needed but as a query it's killing performances.
I think you could change your code to filter out nodes before passing ids to the query as you are already filtering them in the fetchUnreadPostCountForUser function.
Clément
A customer of mine which has a big board (180k threads / 2.5M posts / hundred of nodes) was experiencing issues too with load times of 3s for the page, every times the cache updates.
I removed the following bit from the query:
PHP:
            INNER JOIN xf_forum AS forum ON
                (forum.node_id = thread.node_id AND forum.find_new = 1)
This would indeed be needed but as a query it's killing performances.
I think you could change your code to filter out nodes before passing ids to the query as you are already filtering them in the fetchUnreadPostCountForUser function.
Clément
Hello,
there were 10 requests from people interested to have the number of new post per specific node instead of whole forum. In 2018 @AddonsLab said it will be done in the futur.
Any plan to add this feature as it seems to be the most requested feature?
Thanks
there were 10 requests from people interested to have the number of new post per specific node instead of whole forum. In 2018 @AddonsLab said it will be done in the futur.
Any plan to add this feature as it seems to be the most requested feature?
Thanks
Hello,
there were 10 requests from people interested to have the number of new post per specific node instead of whole forum. In 2018 @AddonsLab said it will be done in the futur.
Any plan to add this feature as it seems to be the most requested feature?
Thanks
Can you please clarify how exactly you see this feature implemented? Currently, the number of unread posts is added in the navigation bar. Where exactly would you prefer to have the number of unread posts per forum to be shown? I am not sure, I remember other requests for this feature, and which implementation would be the best for all our users. We will implement the feature as soon as we have heard from some users regarding this feature.
Thank you!
Having major load issues with this plugin as well where I'll need to disable it. Does the dev plan to fix this issue? Thanks.Hello,
A customer of mine which has a big board (180k threads / 2.5M posts / hundred of nodes) was experiencing issues too with load times of 3s for the page, every times the cache updates.
I removed the following bit from the query:
PHP:INNER JOIN xf_forum AS forum ON (forum.node_id = thread.node_id AND forum.find_new = 1)
This would indeed be needed but as a query it's killing performances.
I think you could change your code to filter out nodes before passing ids to the query as you are already filtering them in the fetchUnreadPostCountForUser function.
Clément
AddonsLab updated [AddonsLab] Unread Post Count with a new update entry:
Performance fix
Read the rest of this update entry...
Performance fix
The package optimizes the query for fetching unread posts as recommended by @XFA
As we already fetch the nodes in a separate query, no additional query was required.
Thank you!
Read the rest of this update entry...
Any word @AddonsLab on of is possible to have an option to have the red boxed number one the forums tab instead of the what's new tab?Is it possible for the unread posts count to appear by the forums menu link?
Hello, @cdub !
Syre, that's possible, the add-on is using [AddonsLab] Navigation Badge to add the counter, which supports adding badges to any navigation entry. In the Admin Panel -> Setup -> Public Navigation section edit "What's new" and you will see the section that defines a callback which adds the badge:
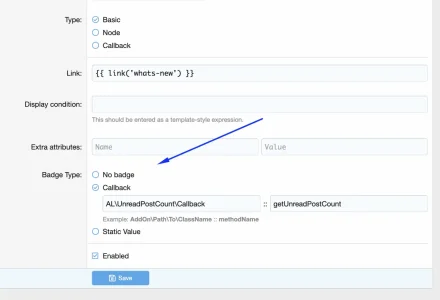
Use exactly the same configuration on any other public navigation menu entry and you will get the counter there. Just choose No badge on What's new to remote the badge from that menu item.
Syre, that's possible, the add-on is using [AddonsLab] Navigation Badge to add the counter, which supports adding badges to any navigation entry. In the Admin Panel -> Setup -> Public Navigation section edit "What's new" and you will see the section that defines a callback which adds the badge:

Use exactly the same configuration on any other public navigation menu entry and you will get the counter there. Just choose No badge on What's new to remote the badge from that menu item.
@AddonsLab I do have a quick feature idea: Add an easy way to "mark" the new post counter as "read", even if you haven't viewed everything yet. What do you think? Just a thought. 
You would just mark the forums read no?@AddonsLab I do have a quick feature idea: Add an easy way to "mark" the new post counter as "read", even if you haven't viewed everything yet. What do you think? Just a thought.
Yes, that makes sense. hehe Thanks!You would just mark the forums read no?
Similar threads
- Replies
- 2
- Views
- 375
- Replies
- 1
- Views
- 525