Php-fpm configuration: encountered and error

Thanks a lot for the lessons @Floren :)
Learn a lot from you guys. (y)

Adjusted Config:
Code:
pm = dynamic
pm.max_children = 16
pm.start_servers = 6
pm.min_spare_servers = 4
pm.max_spare_servers = 10
pm.max_requests = 100
With this config set, I still encounter this:
Code:
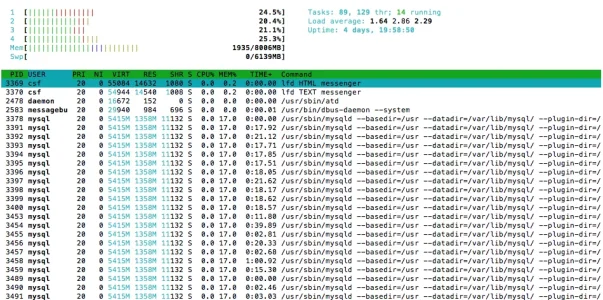
[04-Aug-2014 14:17:46] WARNING: [pool www] server reached pm.max_children setting (16), consider raising it


Edit, I just changed it again to:
Code:
pm = dynamic
pm.max_children = 32
pm.start_servers = 6
pm.min_spare_servers = 4
pm.max_spare_servers = 10
pm.max_requests = 100
 
No, I was testing yours, it failed. :D @MattW's was OK.
weird too many open files is an error on your client server that is running siege though ? read July 25th 2012 to April 24th, 2014 comments http://www.joedog.org/siege-home/#comment-15557 could even be bug in order of commands passed via siege

Eduardo says:
July 25, 2012 at 10:41 am
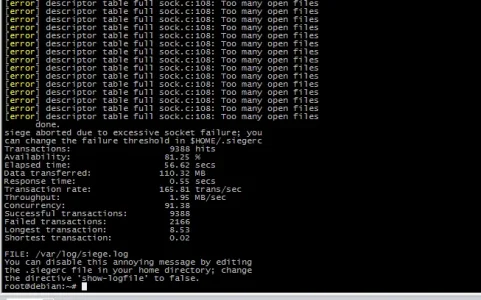
The server is now under siege…[error] descriptor table full sock.c:108: Too many open files
[error] descriptor table full sock.c:108: Too many open files
[error] descriptor table full sock.c:108: Too many open files
libgcc_s.so.1 must be installed for pthread_cancel to work
Aborted

how can i fix this ?


  • 3dac874fe7669000b0f09053e5fab7bb
    Jeff says:
    July 25, 2012 at 12:43 pm
    The error message is telling you exactly what’s wrong. You opened too many files. You have two choices: tune the system running siege or reduce the number of concurrent users.
 
Last edited:
weird too many open files is an error on your client server that is running siege though ?
No, is on your side, you need to increase the file descriptors. What do you have set now? Obviously, having one user for both PHP and Nginx will not help...

This is a test with fastcgi_cache enabled and 5,000 users, to see the difference:
Rich (BB code):
# siege -u https://www.axivo.com/forums/ -c 5000 -d 30 -t 1M
Lifting the server siege...      done.

Transactions:              18042 hits
Availability:             100.00 %
Elapsed time:              59.57 secs
Data transferred:         151.95 MB
Response time:               0.05 secs
Transaction rate:         302.87 trans/sec
Throughput:               2.55 MB/sec
Concurrency:              15.06
Successful transactions:       18042
Failed transactions:              0
Longest transaction:           0.38
Shortest transaction:           0.00

# top -M
top - 04:16:49 up  2:28,  2 users,  load average: 0.01, 0.04, 0.00
Tasks: 158 total,   1 running, 157 sleeping,   0 stopped,   0 zombie
Cpu(s): 10.6%us,  2.0%sy,  0.0%ni, 86.9%id,  0.3%wa,  0.0%hi,  0.3%si,  0.0%st
Mem:  7770.230M total, 1323.508M used, 6446.723M free,   30.242M buffers
Swap: 8191.992M total,    0.000k used, 8191.992M free,  312.996M cached

  PID USER      PR  NI  VIRT  RES  SHR S %CPU %MEM    TIME+  COMMAND               
9780 nginx     20   0  194m  45m 2528 S 15.3  0.6   0:12.82 nginx                
9779 nginx     20   0  194m  45m 2424 S  9.0  0.6   0:15.33 nginx                
9778 nginx     20   0  194m  45m 2540 S  2.3  0.6   0:16.99 nginx                
1341 named     20   0  390m  40m 3084 S  1.0  0.5   0:14.08 named                
9781 nginx     20   0  194m  45m 2524 S  1.0  0.6   0:10.84 nginx                
15686 php-fpm   20   0  995m  20m  13m S  0.7  0.3   0:00.39 php-fpm
 
Last edited:
@eva2000, are you moving mountains with your server? :D
Still that should not be an issue... lower it to:
Code:
# cat /etc/security/limits.d/60-nginx.conf
nginx soft nofile 32768
nginx hard nofile 65536
I'll test again your site... on the same time, check the fastcgi_cache results I posted above. There is no way LiteSpeed will beat Nginx with cache on. By default LiteSpeed has a cache enabled, right? They did not enable it on their tests for Nginx.
no LiteSpeed cache is only for static files, for dynamic PHP, cache is disabled out of the box
 
Last edited:
@RoldanLT, @MattW, I'm not talking about bots etc. I'm talking about forcing any legitimate user not to abuse your server like I did minutes ago. Try to siege AXIVO, you will what you get as result. I certainly did NOT blocked your IP's, heh.
Code:
root@debian:~# siege -u https://www.axivo.com/forums/ -c 5000 -d 30 -t 1M
siege: invalid option -- 'u'
** SIEGE 2.70
** Preparing 5000 concurrent users for battle.
The server is now under siege..      done.
siege aborted due to excessive socket failure; you
can change the failure threshold in $HOME/.siegerc
Transactions:                    210 hits
Availability:                   3.45 %
Elapsed time:                  36.14 secs
Data transferred:               4.97 MB
Response time:                 15.45 secs
Transaction rate:               5.81 trans/sec
Throughput:                     0.14 MB/sec
Concurrency:                   89.77
Successful transactions:         210
Failed transactions:            5876
Longest transaction:            8.36
Shortest transaction:           0.34
FILE: /var/log/siege.log
You can disable this annoying message by editing
the .siegerc file in your home directory; change
the directive 'show-logfile' to false.
root@debian:~#

Done it to my own server
upload_2014-8-4_10-23-25.webp

upload_2014-8-4_10-24-29.webp
 
@MattW, you run a very old Siege version.
# siege -V
SIEGE 3.0.5

Copyright (C) 2013 by Jeffrey Fulmer, et al.
This is free software; see the source for copying conditions.
There is NO warranty; not even for MERCHANTABILITY or FITNESS
FOR A PARTICULAR PURPOSE.
 
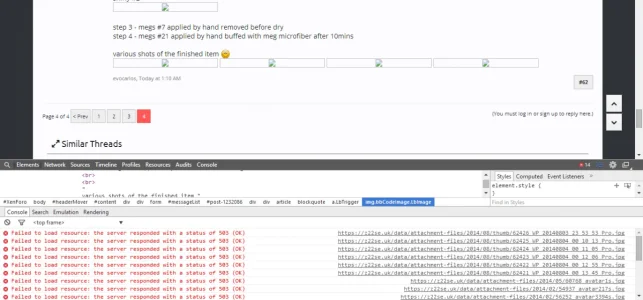
@Floren - in your settings for limit_con, what you are limiting the connections to? I've set 10 on my z22se site, and on threads with multiple images, it's triggering limit causing images to fail

upload_2014-8-4_11-37-28.webp

I had it set to
Code:
        limit_conn addr 10;
but I've increased it to 30 on the .uk domain, as that is only serving static content.
 
@RoldanLT, try these settings and siege your server. Post the results. :)
pm.max_children = 16
pm.start_servers = 10
pm.min_spare_servers = 4
pm.max_spare_servers = 16
But with this, I got slower Timing: 0.12xxx
Where as before I got 0.099xx to 0.100xx
 
Ah, that's what was installed using apt on my debian server.
Set up an Ubuntu site (and or add DotDeb if you haven't already).
My Ubuntu test VPS used (to my Linux forum):
Code:
tracy@tux1:~$ sudo siege -u https://servinglinux.com -c 5000 -d 30 -t 1M
[sudo] password for tracy:
siege: invalid option -- 'u'
** SIEGE 3.0.5
** Preparing 5000 concurrent users for battle.
The server is now under siege...
Lifting the server siege...      done.

Transactions:                2818 hits
Availability:              100.00 %
Elapsed time:               61.09 secs
Data transferred:           46.27 MB
Response time:                2.79 secs
Transaction rate:           46.13 trans/sec
Throughput:                0.76 MB/sec
Concurrency:              128.77
Successful transactions:        2819
Failed transactions:               0
Longest transaction:           14.01
Shortest transaction:            0.00
FILE: /var/log/siege.log
You can disable this annoying message by editing
the .siegerc file in your home directory; change
the directive 'show-logfile' to false.
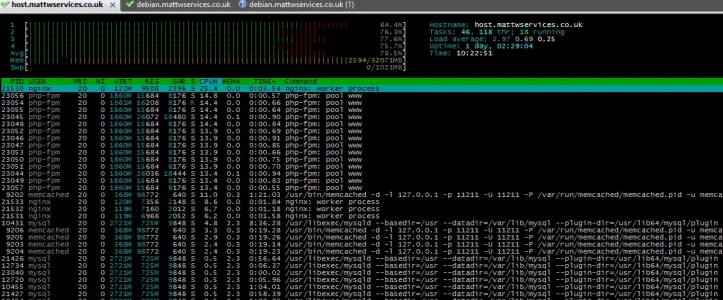
Screen Shot 2014-08-04 at 4.12.31 PM.webp

Of course, I also have (for normal IP's) CSF set up to limit the number of connections to port 80 (but my CIDR is excluded from those).
 
Last edited:
Hahaha, I check my forum index timing every time I do changes.(offtopic- I have tag you on eva's forum :D )
Those are not really real numbers, is just what PHP sees... there are a zillion other factors behind. You might see a slight increase on PHP page load but overall I'm pretty sure the load page is lower.
(offtopic- I have tag you on eva's forum :D )
I'll check it, just got home... will take a shower and see what's up. Freaking hot in Montreal today. :)
 
Those are pretty low numbers Tracy, is this normal? probably because the hardware... I get a way larger number on a very modest server, without fastcgi_cache enabled.
That's just a VPS (RAID10 with enterprise SATA 1GB drives) with minimal tuning on it... I'm sure if it was on a dedicated server the results would be higher.
Code:
tracy@tux1:/var/log$ sudo siege -u https://www.axivo.com/forums/ -c 5000 -d 30 -t 1M
siege: invalid option -- 'u'
** SIEGE 3.0.5
** Preparing 5000 concurrent users for battle.
The server is now under siege...
Lifting the server siege...      done.
siege aborted due to excessive socket failure; you
can change the failure threshold in $HOME/.siegerc

Transactions:                 352 hits
Availability:                6.95 %
Elapsed time:               60.50 secs
Data transferred:            5.65 MB
Response time:               11.55 secs
Transaction rate:            5.82 trans/sec
Throughput:                0.09 MB/sec
Concurrency:               67.19
Successful transactions:         352
Failed transactions:            4714
Longest transaction:            6.00
Shortest transaction:            0.19
was what I got as a result of testing yours.... so your saying that
6.95% availability is better than 100%?
Transaction rate: 5.82 trans/sec is better than Transaction rate: 46.13 trans/sec?
2818 hits is lower than 352?
0.09 MB/sec throughput is better than 0.76MB/sec?
A concurrency of 67.19 is better than 128.77?

I haven't played with siege before so not real familiar with it. It looks like you may be doing some additional throttling that I may not be doing (especially considering that I do no throttling on any of my CIDR).

EDIT:
From reading the manual page for siege I think I see what you are referring to...
 
Last edited:
Top Bottom