Hi guys,
I've really been banging my head on this. I'm trying to get the debugger working on my local install now for like 2 days solid and can't seem to get past this issue.
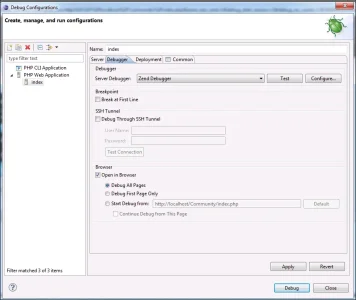
My set up is ZendServer Free edition running php 5.4 and ZendDebugger option turned on. I'm using Eclipse PDT latest version and have got Xenforo set up on a local test installation. Using Windows 7 and using Chrome for my browser. Got eclipse set to use External but have tried both External and interlal browsers.
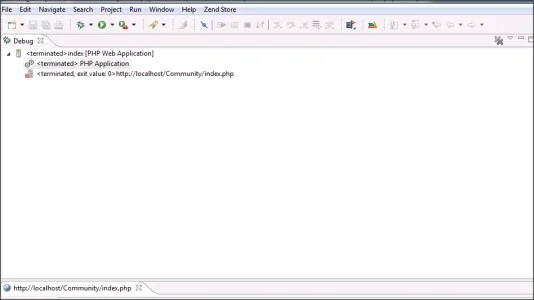
So the trouble I have is that when I try to run a debug session, if I try to run it through the Index.php page it self terminates with the message. Terminated Exit Code 0.
Basically if I set it to break at the first line it does in fact break and I can step line by line ok but if I click continue, it runs and immediately terminates the debug session. If I switch off break at first line and try to run the debug session it just goes straight to the Terminated Exit Code 0. I've also tried 'start debug at this point' and chosen the index.php and continue option and still the same. Literally I've tried everything I can think of. Read all the questions on stack overflow looked at time out settings. Installed the same set up on another pc. You name it. I'm beginning to think there is something that is within index.php that's causing it to auto terminate.
Is there something wrong with my process? Are you meant to start the debugger from a different point or something? I get the same issue if I try to make the starting point admin.php. I notice that in Kier's video: http://xenforo.com/community/thread...at-variables-are-available-in-templates.6960/ he is using a Mac and Firefox but seems to break into the debugger by using a refresh and debug with eclipse listening rather than launching the full session from the very start at index.php. So i'm also pondering whether it's something to do with it not being logged in yet or something or perhaps trying to run the session from the very start through the ajax or something is not possible?.
I've tried a number of times also with the XDebug option but using that it doesn't terminate but doesn't seem to want to break on any of the break points, either.
I can't believe that something so simple should be so difficult. Any thoughts guys?
I can make a video if it would help to show the process I'm following?
Thanks for any help.
Ross
I've really been banging my head on this. I'm trying to get the debugger working on my local install now for like 2 days solid and can't seem to get past this issue.
My set up is ZendServer Free edition running php 5.4 and ZendDebugger option turned on. I'm using Eclipse PDT latest version and have got Xenforo set up on a local test installation. Using Windows 7 and using Chrome for my browser. Got eclipse set to use External but have tried both External and interlal browsers.
So the trouble I have is that when I try to run a debug session, if I try to run it through the Index.php page it self terminates with the message. Terminated Exit Code 0.
Basically if I set it to break at the first line it does in fact break and I can step line by line ok but if I click continue, it runs and immediately terminates the debug session. If I switch off break at first line and try to run the debug session it just goes straight to the Terminated Exit Code 0. I've also tried 'start debug at this point' and chosen the index.php and continue option and still the same. Literally I've tried everything I can think of. Read all the questions on stack overflow looked at time out settings. Installed the same set up on another pc. You name it. I'm beginning to think there is something that is within index.php that's causing it to auto terminate.
Is there something wrong with my process? Are you meant to start the debugger from a different point or something? I get the same issue if I try to make the starting point admin.php. I notice that in Kier's video: http://xenforo.com/community/thread...at-variables-are-available-in-templates.6960/ he is using a Mac and Firefox but seems to break into the debugger by using a refresh and debug with eclipse listening rather than launching the full session from the very start at index.php. So i'm also pondering whether it's something to do with it not being logged in yet or something or perhaps trying to run the session from the very start through the ajax or something is not possible?.
I've tried a number of times also with the XDebug option but using that it doesn't terminate but doesn't seem to want to break on any of the break points, either.
I can't believe that something so simple should be so difficult. Any thoughts guys?
I can make a video if it would help to show the process I'm following?
Thanks for any help.
Ross