table cache hit rate

MattW

Well-known member
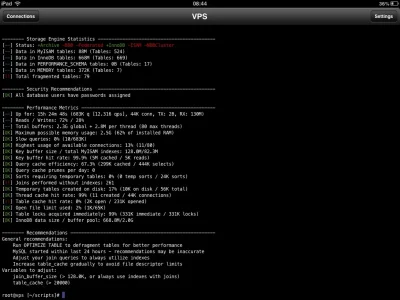
I've recently been running MySQL tuner, and it keeps reporting that my table cache hit rate is at 0%

It's only just started reporting this, as it used to report:

1K open / 14K opened after 20 days of uptime

It's now reporting a LOT more tables being opened, even after just 15 hours
image.webp

Any recommendations on these settings?


# CACHES AND LIMITS #
tmp_table_size=32M
max_heap_table_size=32M
query_cache_type=1
query_cache_size=128M
query_cache_limit=8M
max_connections=80
thread_cache_size=16
open_files_limit=65535
table_definition_cache=4096
table_open_cache=20000
 
and the output from tuningprimer.sh regarding the tables

TABLE CACHE
Current table_open_cache = 20000 tables
Current table_definition_cache = 4096 tables
You have a total of 1241 tables
You have 2171 open tables.
The table_cache value seems to be fine

TEMP TABLES
Current max_heap_table_size = 32 M
Current tmp_table_size = 32 M
Of 48940 temp tables, 17% were created on disk
Created disk tmp tables ratio seems fine

TABLE SCANS
Current read_buffer_size = 128 K
Current table scan ratio = 64 : 1
read_buffer_size seems to be fine
 
What's your table_open_cache setting?

I would love to know what app that is you are using for the iPad? Thanks.
 
I changed a few things round yesterday and put a few variables back to how they were a few months back, and it's looking at lot better now

Code:
# CACHES AND LIMITS #
tmp_table_size=64M
max_heap_table_size=64M
query_cache_type=1
query_cache_size=128M
query_cache_limit=8M
max_connections=80
thread_cache_size=16
open_files_limit=65535
table_definition_cache=4096
table_open_cache=4096

Code:
 >>  MySQLTuner 1.2.0 - Major Hayden <major@mhtx.net>
>>  Bug reports, feature requests, and downloads at http://mysqltuner.com/
>>  Run with '--help' for additional options and output filtering
 
-------- General Statistics --------------------------------------------------
[--] Skipped version check for MySQLTuner script
[OK] Currently running supported MySQL version 5.5.29-29.4-log
[OK] Operating on 64-bit architecture
 
-------- Storage Engine Statistics -------------------------------------------
[--] Status: +Archive -BDB -Federated +InnoDB -ISAM -NDBCluster
[--] Data in MyISAM tables: 89M (Tables: 524)
[--] Data in InnoDB tables: 659M (Tables: 669)
[--] Data in PERFORMANCE_SCHEMA tables: 0B (Tables: 17)
[--] Data in MEMORY tables: 372K (Tables: 7)
[!!] Total fragmented tables: 83
 
-------- Security Recommendations  -------------------------------------------
[OK] All database users have passwords assigned
 
-------- Performance Metrics -------------------------------------------------
[--] Up for: 13h 6m 45s (602K q [12.770 qps], 44K conn, TX: 2B, RX: 95M)
[--] Reads / Writes: 74% / 26%
[--] Total buffers: 1.3G global + 2.8M per thread (80 max threads)
[OK] Maximum possible memory usage: 1.6G (38% of installed RAM)
[OK] Slow queries: 0% (8/602K)
[OK] Highest usage of available connections: 11% (9/80)
[OK] Key buffer size / total MyISAM indexes: 128.0M/82.5M
[OK] Key buffer hit rate: 99.8% (2M cached / 4K reads)
[OK] Query cache efficiency: 64.0% (232K cached / 363K selects)
[OK] Query cache prunes per day: 0
[OK] Sorts requiring temporary tables: 0% (0 temp sorts / 16K sorts)
[!!] Joins performed without indexes: 230
[OK] Temporary tables created on disk: 19% (3K on disk / 15K total)
[OK] Thread cache hit rate: 99% (9 created / 44K connections)
[OK] Table cache hit rate: 91% (1K open / 1K opened)
[OK] Open file limit used: 2% (1K/65K)
[OK] Table locks acquired immediately: 99% (236K immediate / 236K locks)
[OK] InnoDB data size / buffer pool: 659.8M/1.0G
 
-------- Recommendations -----------------------------------------------------
General recommendations:
    Run OPTIMIZE TABLE to defragment tables for better performance
    MySQL started within last 24 hours - recommendations may be inaccurate
    Adjust your join queries to always utilize indexes
Variables to adjust:
    join_buffer_size (> 128.0K, or always use indexes with joins)
 
FYI mysqltuner values and recommendations are just based on a preconceived and not entirely accurate formula

i.e.
in relation to mysqltuner.pl original version, table cache hit rate recommendation is triggered when the ratio of tables open to tables opened is less <20:1

This ratio doesn't really mean much, as tables opened is incremented when you hit table_open_cache limit but also is increased with temp table creation. I suspect raising your max tmp/heap sizes from 32M to 64M did more good for this. Not going into a long explanation, but if you look at tuningprimer.sh it reports tables cached is fine.

Just remember tuningprimer.sh and mysqltuner.pl only report guidelines and you need to look at the actual numbers/stats themselves to determine if you're running optimally and not just rely on preconceived formulas and ratios ;)
 
Glad I found this thread as I've also had this issue. I'll have to look at increasing my tmp/heap sizes as well.
 
Glad I found this thread as I've also had this issue. I'll have to look at increasing my tmp/heap sizes as well.
Cause and solution might not be entirely the same - as I said above, depends on specific values for various status variables.
 
Top Bottom