XF 1.2 Resource Spikes - No Errors - Help!

Bill.D

Active member
Hey All,

I could really use any help / advice or just a point in a good direction. Our Xenforo Install is having these massive processor spikes and I can figure out what is causing them. Here is what it looks like:
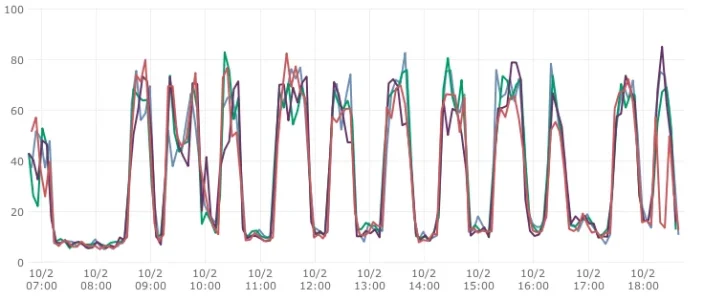
Screen Shot 2013-10-02 at 12.45.48 PM.webp
I have 4 Large AWS EC2 systems running where I only had 2 before.

I can say that all of this started roughly around the 30th of September.

Here are our Forum's Stats:

  • Discussions: 69,635
  • Messages: 2,147,068
  • Members: 117,550

Heres what I have Looked at and tried:
  • I have interviewed everyone on the staff and everyone has been working on other projects that do not concern this Xenforo install.
  • I have assumed that maybe it was a plugin and have individually turned each off one at a time.
  • Looking at the spikes it looks cyclical so I though may cron. I disabled the hourly & user upgrade crons. I also edited the specific cron files and commented out what they did.
  • I have checked the Xenforo Server Error Logs but I only saw 2 errors:
    An there are more spikes than there are errors, so I have ruled these out.
  • I have looked at the php error log and did find a couple of these:
    [01-Oct-2013 11:54:29] PHP Fatal error: Allowed memory size of 134217728 bytes exhausted (tried to allocate 72 bytes) in /xxxx/xxxx/milepoint.com/xxxx/forums/library/Zend/Db/Statement/Mysqli.php on line 304
    which makes me believe it is something that involves the Database. However I have not had another one in a day or two and the spikes still occur.
  • I have gone into the DB and Repaired all of the Users Tables, The xf_session Table, & the Threads Table.
  • We have just (as of last night) upgraded from 1.1.3 to 1.2.2 (Hoping this would solve the issue) and I did notice that with the Board deactivated the spikes subsided but the Instant (and I mean instant) it was active again; the spikes immediately returned. This makes me think that it is not anything malicious since it was so instant. It makes me feel like it is some internal process.
  • I an currently going to collect all SQL queries to see whats going on there. I will post a section of those as well.
With all of that being said. Would anyone know of anything cyclical within the Xenforo system that could do this. A possible theory I have at this point is that a Table may be too big or got to big around the 30th and some natural process with Xenforo now has too big of a job. But I don't feel our Forum is that big.
 
Which add-ons do you have installed?

Does it occur with all add-ons disabled?

There are forums running XenForo with in excess of 10 million posts without issue, so it's not a generic database/table issue.
 
By the looks of the timing of the spikes, it looks like some sort of cron job -- most likely not a default one. Do you have any that start around the 30 minute mark of each hour?
 
Hey Brogan,

Here are the installed Add-on's:
  • Cliptheapex.com's Countdown Timer 1.4.5_EQnoble (Disabled)
  • Custom BBCode Manager 1.3.4 (Enabled)
  • FoolBotHoneyPot - Stop bots from registering with honey pots 2.0.10 (Disabled)
  • ForumRunner for XenForo 1.1.3 (Enabled [Until we Get Responsive Working])
  • Kotomi 0.0.1 (Disabled)
  • MailChimp 0.9.1 (Enabled)
  • MassAlert 0.1.0 (Disabled)
  • Minorin 0.0.5 (Enabled)
  • Multiple Account Detection 1.0.1 (Enabled)
  • Registration Form Timer 2.0 (Enabled)
  • Show Hide Node Blocks 1.1.0 (Disabled)
  • Solve Media 1.0 (Enabled)
  • TrophyPromo 0.0.1 (Disabled)
  • XenForo Enhanced Search 1.0.0 (Enabled)
  • [8wayRun.Com] XenAtendo (Events) 1.5.0 (Enabled)
  • [8wayRun.Com] XenCarta (Wiki) 1.3.9 (Enabled)
  • [8wayRun.Com] XenMedio (Media) 1.5.3 (Enabled)
  • [bd] Paygate: AUTHORIZE.NET 1.0 (Disabled)
  • [bd] Paygates 1.1.2 (Disabled)
  • [bd] Widget Framework 2.4.1 (Enabled)
  • [splendidpoint.com] AntiSPAM - Prevent Links and Emails 1.0.1 (Enabled)
  • [WMTech] - Maintenance Screen PRO 1.1.0 (Disabled)
 
Here are the Crons:
  • MassAlert Daily Clean Up - Next Run: Feb 16, 2012 at 9:00 PM
  • Rebuild Board Totals Counter - Next Run: Oct 3, 2013 at 9:23 AM
  • Forum Runner: Push Notification Service - Next Run: Oct 3, 2013 at 9:26 AM
  • Update View Counters - Next Run: Oct 3, 2013 at 9:30 AM
  • Feeder - Next Run: Oct 3, 2013 at 9:32 AM
  • Update User status - Next Run: Oct 3, 2013 at 9:40 AM
  • Delete Expired Bans - Next Run: Oct 3, 2013 at 9:45 AM
  • Downgrade Expired User Upgrades - Next Run: Oct 3, 2013 at 9:50 AM
  • Handle Expired Warnings - Next Run: Oct 3, 2013 at 9:55 AM
  • Hourly Clean Up - Next Run: Oct 3, 2013 at 10:10 AM (***Tried Disabling this)
  • User Group Promotions - Next Run: Oct 3, 2013 at 10:20 AM (***Tried Disabling this)
  • Record Daily Statistics - Next Run: Oct 3, 2013 at 6:30 PM
  • Daily Clean Up - Next Run: Oct 3, 2013 at 9:00 PM
  • XenCarta: Daily Clean Up - Next Run: Oct 3, 2013 at 9:45 PM
  • XenMedio: Daily Clean Up - Next Run: Oct 3, 2013 at 10:00 PM
  • XenAtendo: Rebuild Recurrences - Next Run: Oct 3, 2013 at 11:00 PM
 
Is this server running PHP (+ a web server), MySQL, or both? If it's only one, does the load appear on both types around the same time?

Did anything change around September 30th? Even settings being changed in the ACP.

If the load is MySQL, logging slow queries may help to try to identify it. I suppose you could disable every cron to see if that stops it and then build them back up.

It's possible that MySQL's InnoDB settings could need tuning, though I'd expect the load to ramp up for the most part, but I suppose if it pushed more data out of the cache that could significantly ramp up disk reads.
 
Hey Mike,

They are Apache + PHP systems that connect to an AWS RDS MySQL server. Both MySQL AND the Servers Spike together. I have the long_query_time set to 300ms but nothing is coming up. i have since lowered it to 200ms and I am awaiting to see if anything is captured. As far as anything changing, unless it was automated (Which I don't have much of) Everyone here hasn't touched the system in a month whether it be server or the Admin back end.
 
Here is a edited bit of the SQL capture during a spike.

The only thing that I could recognize as weird (not that I know everything about Xenforo.. I don't!)

Code:
        141536594 Prepare    INSERT INTO xf_session_activity
                    (user_id, unique_key, ip, controller_name, controller_action, view_state, params, view_date, robot_key)
                VALUES
                    (?, ?, ?, ?, ?, ?, ?, ?, ?)
                ON DUPLICATE KEY UPDATE
                    ip = VALUES(ip),
                    controller_name = VALUES(controller_name),
                    controller_action = VALUES(controller_action),
                    view_state = VALUES(view_state),
                    params = VALUES(params),
                    view_date = VALUES(view_date),
                    robot_key = VALUES(robot_key)
        141536582 Close stmt

But it does say Prepare so I think it should be fine!?

Thanks for everything and all of the advice,
-Bill
 

Attachments

Unfortunately, I'm not seeing anything particularly obviously untoward there. The query you've mentioned is completely normal (and will be very common).

Assuming you have APC or a similar opcode cache, you will likely benefit from storing the templates in the file system (though since it sounds like you have multiple web servers, you need to be very careful of this -- the files need to be created and maintained between all of them; I'd guess you've already dealt with this for the internal_data/ and data/ directories).

Using Memcache to cache data and sessions could also be of benefit.

However, these are general improvements and wouldn't really relate to the spikes that you're seeing.
 
Hey Mike,

Thanks for looking it over. Yah.. no caching at the moment, though I do Have a whole new system I am waiting to move it to; that does have all of that. I am just cautious about moving it with this issue suddenly appearing :-/. Also, yes; they do share a single storage point.

Anyways, Thanks again and if you or anyone else has any ideas.. Please Share! I will also post should I figure it out or should it disappear as oddly as it showed up.

Thanks,
-Bill
 
Since it seems to be happening quite frequently, you should be able to get away with disabling all/almost all cron entries for an hour or so to see if it stops. Conversely, it could simply seem to be one of those "cascading failures" things: one slow page causes a backlog that just gets worse for a while.

If you want me to, I may be able to login and have a look, though I would need SSH access as I'd need to monitor a few different things I think (MySQL processlist, top, I/O perhaps), so I understand that's not necessarily something you would be comfortable giving out. Drop a ticket in if you want (though it wouldn't be until tomorrow at the earliest that I could do anything).
 
Hey Mike,

We were early adopters of Xenforo way back in the day.. I trust you :). I can say that the MySQL is an AWS RDS so there is no ssh there. I can give you Admin & SSH to the Web Servers though. Would that be good enough? Where should I give you the the credentials to get in? a Private Message?

-Bill
 
OK, that aside. I just noticed that even though I have elastic search enabled I have new data in the xf_search table. I though with elastic search enabled that it doesn't use the table anymore. Could that be the issue? Should't I see elastic search errors in the "Server Error log" if it wasn't working?

-Bill
 
Submitting the info via the sensitive data section of a ticket is preferable. You can do this in the customer area.

And the xf_search table is always used. It's the search index table that XFES stops using.
 
Top Bottom