my forum with 100 simultaneous users hosting experience

You will either start getting slow responses

And we did experience significant slow down when the average CPU usage has increased to 100% due to Wordpress website overloading the account.
Theory is one thing, real world experience is another. That's why I think this thread might be useful for people like me in future.
Running the account intermittently at maximum CPU didn't cause any issues so far and honestly - I don't see why it would do that. It works like any other system, when you perform a task, it tries to use 100% of its available processing power.

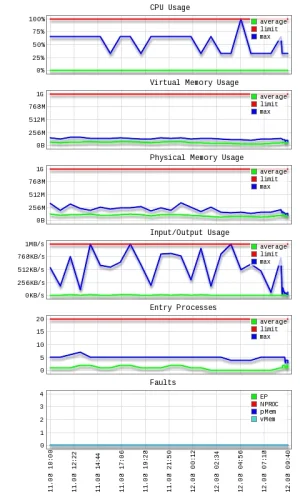
As I already said - I am open to suggestions. In the meantime I will be posting my stats. Pingdom is checking response time of my website every minute.
 
Theory is one thing, real world experience is another. That's why I think this thread might be useful for people like me in future.
Running the account intermittently at maximum CPU didn't cause any issues so far and honestly - I don't see why it would do that.
Believe what you want.... but once you reach 100% of anything you can't squeeze any more out of it (they aren't warp engines powered by dilithium crystals). ;)
When you are at maximum resource use something has to give... either the system becomes very slow (and eventually unresponsive) or the load drops (either by system setup or some other mechanism). All CL does is make it so that YOUR hogging of the assigned resources should not effect anyone else on that server. It doesn't mean squat on keeping you from overwhelming your site/server.

It works like any other system, when you perform a task, it tries to use 100% of its available processing power.
Really? Those charts that I showed you were on a dedicated server running 17 VPS's (sizes range from 8GB to 2GB).. you notice that it's not sitting around 100% (nor even around 66%)?

As I already said - I am open to suggestions. In the meantime I will be posting my stats. Pingdom is checking response time of my website every minute.
Uptime ping (which doesn't mean much - a couple of my VPS's would show down all the time as they are set not to respond to pings)?
 
Really? Those charts that I showed you were on a dedicated server running 17 VPS's (sizes range from 8GB to 2GB).. you notice that it's not sitting around 100% (nor even around 66%)?
Aren't your charts showing average load? ;)
My charts are showing 0% average use, because the next step on that scale is 33% and the average use is closer to 0% than 33%.
 
Uptime ping (which doesn't mean much - a couple of my VPS's would show down all the time as they are set not to respond to pings)?
From what I understand ping is very different to website response time. Please explain if I am wrong.
 
Aren't your charts showing average load? ;)
My charts are showing 0% average use, because the next step on that scale is 33% and the average use is closer to 0% than 33%.
But in a more beneficial step rate than a fixed 0/33/66/100. That was my point. You can't get a true reading on the load when it's only broken down to thirds.
 
From what I understand ping is very different to website response time. Please explain if I am wrong.
Ping is... it's just checking to see if your site is up. I hope you aren't running the equivalent of that test every minute on your site. My CSF would lock them out (iptables drop) if that happened.
 
You are walking in a thin line here. Be carefull. It's not wrong to squezee your CPU, but some people like to play safe. Don't install too much addon and style.
 
Last night I enabled Opcache on my account and I think CPU load dropped a bit. Still, the site was plenty fast before that. I will appreciate your input on my site performance. Please take a look.
 
Last edited:
Aren't your charts showing average load? ;)
My charts are showing 0% average use, because the next step on that scale is 33% and the average use is closer to 0% than 33%.

I still say the average load (green line) is not working properly. You CAN'T have a constant 66% CPU load over 4 hours, and the average be 0%. It doesn't work that way. In the 4 hour graph you posted, you are continuously using a great deal of CPU.
 
  • Like
Reactions: Xon
I still say the average load (green line) is not working properly. You CAN'T have a constant 66% CPU load over 4 hours, and the average be 0%. It doesn't work that way. In the 4 hour graph you posted, you are continuously using a great deal of CPU.

I think I should explain more about maximum and average values in maths world. There is a big difference between the two. If during 4 hours maximum CPU usage is at 66% for example every 10 minutes for a period of one second (enough to present a graph like mine), that will barely be any influence on the average graph and it will not go anywhere close even to 33%. It's like drinking water. You can drink a glass of water every hour. It takes you one minute. The average 1 minute graph would show you 1 glass per minute. The average 1 hour graph would show you 1/60 of a glass per minute. On a 24 hour graph that would present constant peaking maximum value, while average would still be at around 0.
 
Here is a nice article explaining how resource limiting in Cloud Linux works: http://www.rootusers.com/a-guide-to-cloud-linux/

Also, over 24 hours ago I enabled opcache and my CPU usage stats have dropped, while RAM stats slightly increased, take a look:

24 hours graph:

usage.webp

I have to say I am loving LiteSpeed and CloudLinux. It's plenty fast for a forum like mine.

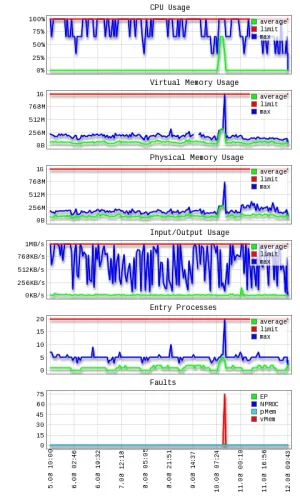
And here is last 7 days graph, which shows a moment when my Wordpress was under attack and @WSWD experienced over 20 seconds load time. That was a nice example to see Cloud Linux limiting in action.

usage2.webp

Something that I want to say from my experience - after many years of running my community website, this is the fastest hosting I have ever had, including one VPS. Also what's great about it, it is actually very VPS-like, with clearly shown resource limits, SSH access, ability to enable/disable PHP modules (Zend Opcache, Memcache, APC, XCache, etc.) They even installed Midnight Commander for me so I could easily transfer files directly between servers.
 
Last edited:
I don't need a lesson in how CloudLinux works. I use it every single day. My point still stands.

As I mentioned in my very first post, you were maxing out your CPU limit regularly. Go back and look at the graph you originally posted. Doesn't matter if it's for 1 minute or an hour. Every time you hit those limits, your site is going to slow down noticeably.
 
  • Like
Reactions: Xon
I don't need a lesson in how CloudLinux works. I use it every single day. My point still stands.
My post with link is directed to everybody that might be interested in the topic.

As I mentioned in my very first post, you were maxing out your CPU limit regularly. Go back and look at the graph you originally posted. Doesn't matter if it's for 1 minute or an hour. Every time you hit those limits, your site is going to slow down noticeably.
The point is, that since the very beginning of this thread I am talking about the experience of my users: Even if occasionally maximum CPU Load values touching limit, the site is still running fast. The average usage stays close to 0%, but we don't really know how close. Perhaps average of 15% is still being registered as 0% on that graph, as the next step is 33% on that grid. The maximum values in this case tell us that there are points in time when the account hits 100%. They don't tell us how often and how long those last. Average usage is very low. That let us assume that maximum usage happens very rarely and those moments are very short in time. That's why neither the average graph is wrong, neither the users experience noticeable slow down periods. That experience is something that I find interesting and worth sharing with the community here. Thank you for taking part in this thread and for sharing your experience of my site's response time during account overload period documented in the stats above. In a spare moment please take time to test my website again and please share what you think about its performance. Thank you!
 
In a spare moment please take time to test my website again and please share what you think about its performance. Thank you!

It's definitely not bad now. It's not terribly fast for me, but again, I think the majority of that is just the latency beween LA and Amsterdam.
 
It's definitely not bad now. It's not terribly fast for me, but again, I think the majority of that is just the latency beween LA and Amsterdam.

In theory, would something like CloudFlare help to decrease that latency?
 
All CL does is make it so that YOUR hogging of the assigned resources should not effect anyone else on that server.

It works to my advantage as well, because my account is not affected by others. That's probably why Cloud Linux makes for the best shared hosting experience I have had for years of running my forums.
 
In theory, would something like CloudFlare help to decrease that latency?

Ehhhhh...probably not. In theory it does help with the static content, but it probably isn't going to make much difference. It really isn't bad enough to worry about it (in fact, it is pretty quick), especially since your target audience isn't in the US.
 
One problem with Host Hawk and Xenforo is that ft_min_word_len is set to 4 and they don't want to change it to 3. I actually went through 4 or 5 shared hosts in the past and in every single case support changed that value to 3 upon my request. Hawk Host refused and I asked to escalate the case to higher level support and reconsider. If they refuse, I will need to look for a similar hosting with ft_min_word_len=3.

Does anyone know hosting company that might be using the same Data Center in Amsterdam as HostHawk?
 
Top Bottom