my forum with 100 simultaneous users hosting experience

jacko

Well-known member
I used to run my forums on shared HostGator account until it was bought by some other company and my site was moved to a slower server in a different data center. Since then I started looking for some good shared hosting but after some time I finally found inexpensive VPS on Host1Plus. It was fine in terms of speed but there was too much to deal with server configuration, installing and maintaining software, etc. and sometimes it was incredibly slow for 10-15 minutes without any reason. Sometimes it would be completely offline.

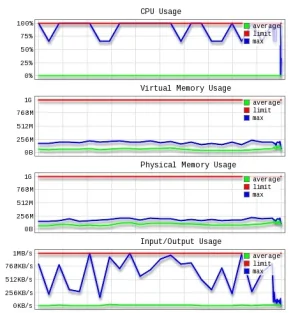
Then, in recent days, I tested HawkHost shared account recommended somewhere here on Xenforo forums. Their shared account is based on Cloud Linux which works in similar way to VPS in terms of resource limitation. I can access resource usage stats. I run it on the limit, but actually my forum is much faster than it was on Host1Plus VPS where I was running at probably 20% of my resources. Here is my HawkHost last 24 hours usage report:
Screen Shot 2014-08-07 at 10.52.51.webp

I recommend it for forums with less than 100 online users. cPanel based, SSD drives - plenty fast. And data centers also in Europe.

They said if I find resources too limiting I may upgrade my account to Semi-Dedicated which has twice the power. But so far I am absolutely fine on regular shared account.

Big thumbs up for HawkHost.
 
They said if I find resources too limiting I may upgrade my account to Semi-Dedicated which has twice the power.

Absolutely fine on a regular shared hosting account? You're already maxing out the CPU almost continually. I'd seriously look at making that upgrade soon, since your users are going to get errors every time you hit those limits.
 
  • Like
Reactions: Xon
Absolutely fine on a regular shared hosting account? You're already maxing out the CPU almost continually. I'd seriously look at making that upgrade soon, since your users are going to get errors every time you hit those limits.

No one is getting any errors. Check http://dzwiek.org/
 
No one is getting any errors. Check http://dzwiek.org/

They're not telling you they're getting errors. See the first graph you posted. Every time the blue goes into the red, you are reaching your CPU limit, and users are going to get errors during that period, after your website is throttled. That's how CloudLinux works. According to the graph, you are hitting that limit fairly regularly. At the minimum, your site is definitely going to slow down during those periods, as you have exhausted the CPU limit.
 
They're not telling you they're getting errors. See the first graph you posted. Every time the blue goes into the red, you are reaching your CPU limit, and users are going to get errors during that period, after your website is throttled. That's how CloudLinux works. According to the graph, you are hitting that limit fairly regularly. At the minimum, your site is definitely going to slow down during those periods, as you have exhausted the CPU limit.

That's not the case at all. I already said - no one is getting any errors. We are quite close community and if anything goes wrong, someone tells that. The way hosting company described that - the account is peaking CPU resources and the server makes sure it will not go beyond that, there won't be any errors for users. Please take your time to see how my forum works. There is a good chance that you will be using it while it is at 100% CPU.
 
They're not telling you they're getting errors. See the first graph you posted. Every time the blue goes into the red, you are reaching your CPU limit, and users are going to get errors during that period, after your website is throttled. That's how CloudLinux works.

From CloudLinux website, to confirm you are wrong about the errors:

"
If the site is limited by CPU or IO -- the site will start responding slower.

"
 
Okay...I'm on your forum right now (1am PDT), and it took 27 seconds for your forum to load, on a 1gbit connection in Los Angeles. Taking anywhere from 10-15 seconds to load subsequent pages. Could be the latency between LA and Amsterdam (150ms), but it isn't fast by any stretch of the imagination.

From CloudLinux website, to confirm you are wrong about the errors:

"
If the site is limited by CPU or IO -- the site will start responding slower.

"

If that's the case, it's a change. It used to throw 503 errors for CPU. Guess it's just RAM and processes now.
 
it is slow now indeed, but the load is currently low - that's an issue with data center I guess...
still, I had worse overall problems with VPS, that's all - I am sure I'd get better results with +$50/month VPS hosting, but that's just too much for hobbyst non profit website
 
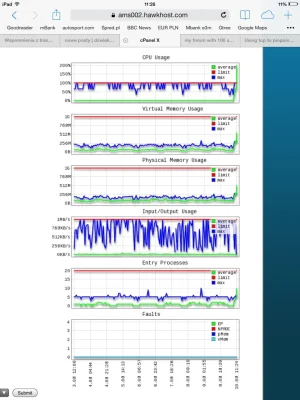
Actually, what's happening right now - the green line went to 100% and what we are experiencing now is CPU limiting, which apparently takes place when the average load (green line) goes to 100%. This is happening for the first time in 10 days, coincidentally with this discussion. I'm wondering if this isn't some sort of ddos attack.
 
image.webp

To confirm what I wrote before, the green CPU line moved for the first time. I will investigate where the spike comes from. It's Sunday morning here and very few users are online.
 
Okay...I'm on your forum right now (1am PDT), and it took 27 seconds for your forum to load, on a 1gbit connection in Los Angeles. Taking anywhere from 10-15 seconds to load subsequent pages. Could be the latency between LA and Amsterdam (150ms), but it isn't fast by any stretch of the imagination.


If that's the case, it's a change. It used to throw 503 errors for CPU. Guess it's just RAM and processes now.
My Wordpress site on the same account was under attack. I took it offline, check the speed now.
 
There won't necessarily be errors... but there WILL be a noticeable slow down.

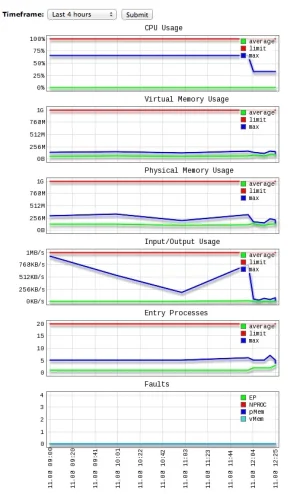
There was one noticeable slow down today, 10 days after I switched to the account. It was caused by some Wordpress glitch. The account was slowed down when average load (green line) went up to 100%. For the rest of 10 day period the average load line stayed at 0% at all times. After I identified and tackled the problem, the account went back to normal fast operation. I set up website monitoring at pingdom which tests the site in 1 minute intervals. So far, for the first 10 hours or so, the response time has been very stable.
 
You're already maxing out the CPU almost continually.
The blue line shows maximum usage. You should look at green line which is at 0%. It's nowhere close to maxing out. You actually were very lucky today to experience maxing out when the green line went up to 100% (caused by Wordpress).
 
The blue line shows maximum usage. You should look at green line which is at 0%. It's nowhere close to maxing out.

I understand that. It is the peaks that are going to cause your site to slow down. Regardless, if you look at the blue line, you are almost constantly between 75-100%. That's not good, regardless of what the average is telling you. In fact, I'm guessing that average is probably incorrect or not working. How can the average be 0%, when you are maxing out the CPU usage constantly? There are only 4 times in the graph you posted above that your CPU usage ever dropped below 50%.
 
I understand that. It is the peaks that are going to cause your site to slow down. Regardless, if you look at the blue line, you are almost constantly between 75-100%. That's not good, regardless of what the average is telling you. In fact, I'm guessing that average is probably incorrect or not working. How can the average be 0%, when you are maxing out the CPU usage constantly? There are only 4 times in the graph you posted above that your CPU usage ever dropped below 50%.

Max line tells us that instantenous CPU usage was at 100%. That could be 1 second during 1 hour period. That's why you see green line at 0%. That is why the website is running smoothly. Let's not forget it is shared hosting only for $8 a month. I think it is pretty great value.

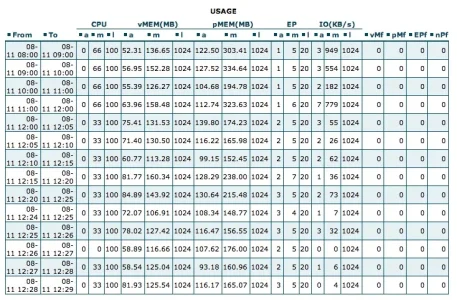
Also, the graph has only 4 values: 0%, 33%, 66% and 100%, so values are rounded up.

Please take a second to visit the site and tell me what you think about its speed.

Anyway, I will keep everyone updated about the site performance. I'm open to suggestions regarding how much it could be improved by moving the site somewhere else, with real world examples.
 
Max line tells us that instantenous CPU usage was at 100%. That could be 1 second during 1 hour period. That's why you see green line at 0%.
And that's why that chart (without a time scale) is about as useless as female appendages on a male boar hog. :whistle:

A more useable one will give you a time period scale somewhere easily found like this
Screen Shot 2014-08-11 at 5.14.12 AM.webp
Screen Shot 2014-08-11 at 5.15.34 AM.webp
Screen Shot 2014-08-11 at 5.15.52 AM.webp
 
As I said: the first chart in the opening post shows 24 hour period, so I think that counts for a time scale?
The second chart shows 7 days time scale.

And here is last 4 hours chart:
Honestly didn't see the comment as I normally look for a time scale on the chart itself as it's much easier to determine the time period of a load problem without having to guess what each grid corresponds to. :)
The point still remains... once you reach 100% of your CPU, it will be just like any other system that is maxed out. You will either start getting slow responses or the system will become totally unresponsive. Being on CloudLinux won't stop that... all it really does is guarantee that YOUR maximum usage won't effect another on the system (in theory.. but you can still have problems with that).
 
Back
Top Bottom