Webmaster stats post conversion to XF

Renegade

Well-known member
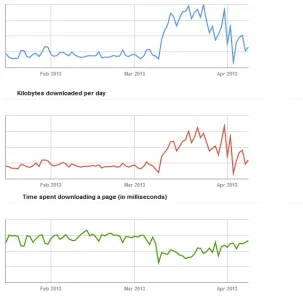
Converted from VB to XF on 9th March. Things don't seem to be going as rosy as for others anymore. The 'time spent' is returning back to where it was. Any suggestions on what all needs to be looked at?
crawl.webp

In recent days I have done the following changes to the site.
  1. Installed TMS
  2. Installed 3 more skins
  3. Enabled user feeds
  4. Installed Conversation manager
  5. Installed Ignore what's new
  6. Installed Route changer
  7. Installed WDB popular content
  8. Installed WDB top users
  9. Installed Xencarta Wiki
  10. Enabled front end and backend cache in config file
  11. Enabled mod_deflate in the htaccess file
Should this be in server optimization forum instead?
 
The 'time spent' is returning back to where it was.

That's the red graph?

What kind of server? Shared/VPS/Dedicated? If you don't already have one then you should install an opcode cache like APC. That will significantly speed up your forum. Addons can also slow down your forum. But if your server is slow then XenForo can't do anything about that.
 
Time spent downloading is the green graph. The red graph is KB downloaded. The scale on green graph is 250, 500, 750 ms.

I am on a dedicated server with 12GB RAM. I installed APC about 2 hours back. Right now I am trying to figure out what all config setting should go into the php.ini as right now it does not have any apc specific setting.
 
What are we looking at here? They look like google crawler stats...

Isn't it a good thing that googles now indexed most of your site and isn't taking as long to any more?

Or is this something else?
 
So you're at almost 750ms? That's pretty high indeed.

Where is your dedicated server and what are the rest of the specs, including OS/PHP/MySQL versions? I'd have thought you should be < 300ms, depending on location etc.

Using a (properly configured) PHP accelerator is a very good start, so that should make a difference to your load times.
 
It is hosted in the US with Servint. (Xeon E5-2430 and 500 GB Nearline SAS)
CENTOS 6.4 x86_64
PHP Version 5.3.21
MYSQL 5.5.30

I have set the APC config with the values in this post -> [Tip] Use APC I have copy pasted that actually :p
Please note that I have installed APC only an hour or so back.

Any other info that I should post?
 
While installing APC I got this following. Now I am wondering why is it marked experimental and yes both and why is default marked as no. I went with that and pthread read/write locks is enabled. Do I have to change it and how do I change it?

Enable internal debugging in APC [no] :
Enable per request file info about files used from the APC cache [no] :
Enable spin locks (EXPERIMENTAL) [no] :
Enable memory protection (EXPERIMENTAL) [no] :
Enable pthread mutexes (default) [no] :
Enable pthread read/write locks (EXPERIMENTAL) [yes] :
 
Top Bottom