VPS crashes with the dreaded oom message....

craigiri

Well-known member
My 1G debian VPS (running XF and WP - light traffic site and small db) crashes once every couple of weeks - seems to be arbitrary, as neither the load, traffic or CPU use is ever heavy. Basically it hangs up and shows an incredibly heavy load until mysql is shut down manually and then restarted. But it's not (IMHO) mysql running out of memory - just that the whole systems seems to panic and overload.

The OOM message shows that Apache get it.....
"apache2 invoked oom-killer"

This happened before I doubled the RAM - and I also use caches for the wordpress and flush RAM once in a while. In other words, I never see the system eating up available memory - the error seems to come out of nowhere....

Looking around the web, I saw some folks mention that it could be a fault of Linux stock settings - that they are not overcommitting:
http://www.hskupin.info/2010/06/17/how-to-fix-the-oom-killer-crashe-under-linux/comment-page-1/

Anyone else have experience with this syndrome? It seems that if it were default behavior in Linux, it would be happening to lots of people!
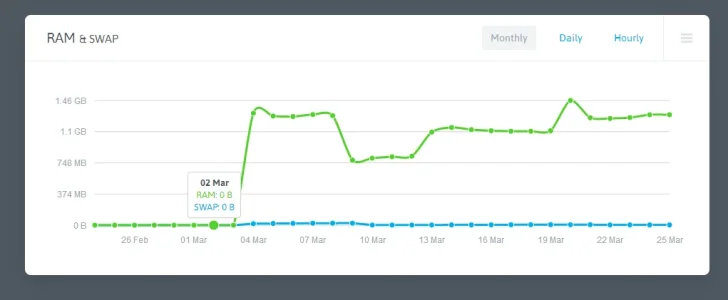
 
Do you have any active monitoring on the VPS, so you can see how RAM is being used over time?

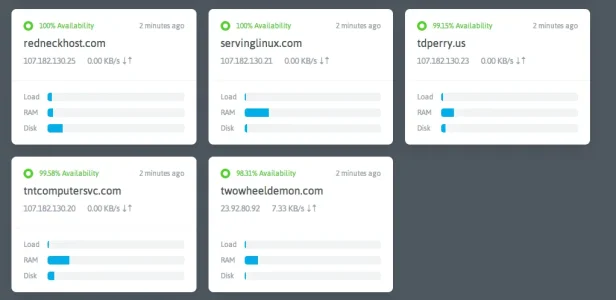
I'd suggest sticking your VPS on here while it's still in free open beta: https://nodequery.com/

Then you can at least monitor it's usage over time, and see if it does tie in with anything:

upload_2014-3-26_8-46-31.webp

EDIT: I also take it you don't have any swap for things to be getting killed off with OOM errors, or you are also using all your swap up.
 
Found your problem! ;)
Really? :p
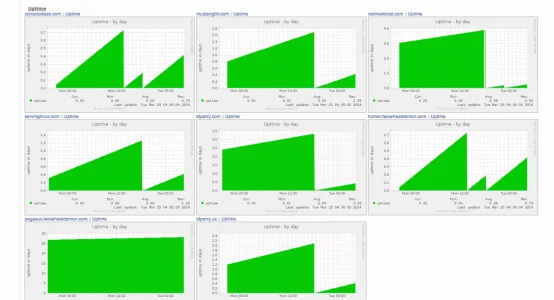
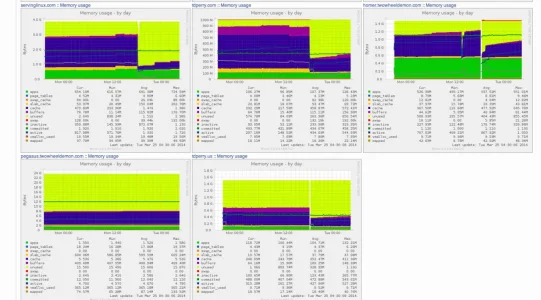
These show some down time due to being recently created on my ProxMox server (which, by the way uses Debian as it's core :whistle: ) and being rebooted during testing. The one that has been up for 30 days was rebooted after I installed CSF and wanted to make sure that I had not completely locked myself out upon a reboot of the server (which I had done before). Before that it had been up for 138 days. Most of the VPS's are using OpenLiteSpeed now for the httpd server.

screenshot.webp screenshot1.webp
 
I'll get my coat :)
Just as long as you take your boots along also. :D
It might get deep when you go talking OS's! Food Fight!!!

Though in my defence, one of my CentOS servers is coming up on 5 years uptime I think, I had one that was longer but a drive failure meant it had to be powered off for a replacement :(
Usually the only time I reboot is when a kernel update comes out. I just can't leave 'em well enough alone. Also, instead of doing a snapshot of my VPS's when I back then up I do a stop of the VPS (it's only down for about 20 seconds) but it reflects as the server being shut down - which it is in fact.
 
Memory is plenty free - swap is there but not used very much.....

Only programs are the usual - mostly apache and mysql......

As I said, it doesn't seem to be anything in the normal course of affairs - I even flush the caches regularly. Memory seems to be using about 1/2 the ram and no traffic or cron or anything else seems to be happening at the time it crashes.

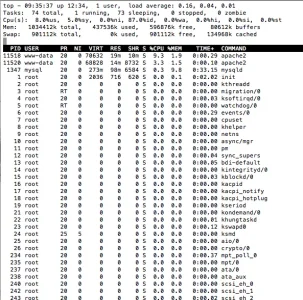
Here is a top screen shot - as you can see, it's not really a busy server. Based on stats, it's usually not being called on at all or perhaps delivering one page - two at the most.

Screen Shot 2014-03-26 at 9.38.02 AM.webp
 
What are the actual logs showing? Not the OOM message, but the actual VPS logs.

I'm not sure where those logs are......if they are the messages, they show almost nothing until the oom, then all kinds of things afterward (stats, memory stuff)...but that's after the panic.

I installed the monitor suggested above and will see if it reports anything on the next crash (or before).
 
I'm not sure where those logs are......if they are the messages, they show almost nothing until the oom, then all kinds of things afterward (stats, memory stuff)...but that's after the panic.

I installed the monitor suggested above and will see if it reports anything on the next crash (or before).


Yes...that's more or less the logs I was referring to. You won't always find something in there, unfortunately.

I honestly don't think this is all that mysterious, if your hearth.com forum is hosted there. You only have 1/2 gig of free RAM, and your forum seems reasonably busy. Apache is what's being killed off, which usually means that is the resource that is using the most memory (processes are usually killed off in order of resource usage, when you start getting OOM errors).

If your hearth.com forum isn't hosted there, I'm honestly at a loss as to what might be causing this, outside of a minor "DDoS attack" of sorts, or bots visiting your site en masse.
 
Hearth.com is on a dedicated server and has never crashed....

This is the drone site which receives about 250-400 page views per hour at max. Load is rarely above .1 - yes, that's point 1, and CPU use of the single VPS slice is usually 0-15%. Total data is quite small in the db's.

If it were bots, I'd suspect that google or my apache logs or even XF might show it?

So, it looks like we are stumped for now......maybe that server monitoring service will show something....I'll report back. It looks like it happens about every two weeks, although not on any particular schedule.


Yeah, that doesn't really make sense then. I could see it happening if hearth.com was there, but if it's just the drone site, that shouldn't really cause that. Bots would likely show up in the logs. Are there any known issues perhaps with the kernel you're using? The only time I have ever experienced something like this (where the logs really show nothing) is on a VPS server, and one particular version of the kernel did not like a piece of hardware we had installed. Would throw OOM errors and then kernel panic. This was on a machine that had almost 200GB of free RAM. It was obviously never coming anywhere close to running out of RAM, which is why the OOM errors really threw us.
 
The only time I have ever experienced something like this (where the logs really show nothing) is on a VPS server, and one particular version of the kernel did not like a piece of hardware we had installed. Would throw OOM errors and then kernel panic. This was on a machine that had almost 200GB of free RAM. It was obviously never coming anywhere close to running out of RAM, which is why the OOM errors really threw us.

This is probably the situation....
How did you narrow down the problem?
 
This is probably the situation....
How did you narrow down the problem?

We actually didn't until afterward. There were absolutely no indications of anything crazy, nothing in the logs, etc. except for the entries saying the machine was run out of memory, which we know was not true. We even hired a couple external admin teams to take a look at things with fresh eyes, and they didn't find anything more than what we did. We went with the kernel update simply because it was time to update, and that did the trick. After that, we built a similar test system with identical hardware, put on the same kernel, and it started having the same problems.

Take all that for what it's worth, because you're on a VPS, and it might be something COMPLETELY different. But you might just want to try updating the kernel amd see what happens.
 
Found your problem! ;)
Nah the OOM problem can happen on CentOS as well. Surprised no one on here has never encountered it considering alot of folks have the server's swap allocation incorrectly set.

@craigiri are you on 32bit or 64bit OS ? post the output of your meminfo command

Code:
cat /proc/meminfo

Check your CommitLimit and Comitted_AS values, if you have alot of memory it's won't all be used if your CommitLimit is below your physically available memory size. Given your screenshot top output I'm guestimating your CommitLimit is around ~1418138 KB

also check sar memory %comimit

Code:
sar -r

Solution = set your swap file size to at least 2x times your physically installed memory size ;) So in craigiri's case set swap at least to 2GB in size.

Basically, system wide memory usage (taking into account overcomitted memory) is hitting your CommitLimit and triggering OOM process which looks for the biggest memory using app which is Apache and kills it. You need to properly tune both system and MySQL/Apache to work under your existing server memory and CommitLimit so you don't trigger OOM process.

I've worked with multi cluster large forum setups and even with 256GB of memory, you can hit OOM if your system isn't properly configured :)
 
Last edited:
Looks like 64 bit - monitoring, as I suspected, shows relatively light use....about a total of 1.2 G in and out in 24 hours, only using 1/3 or so of the RAM. System and CPU use seem to be about 10% or less taken over a long period.

I noticed it has the mkswap commands, etc......wonder if this is something I should attempt to increase or if it's too easy to screw something up!

MemTotal: 1034412 kB

MemFree: 621540 kB

Buffers: 66028 kB

Cached: 124028 kB

SwapCached: 88 kB

Active: 232756 kB

Inactive: 156972 kB

Active(anon): 138960 kB

Inactive(anon): 91600 kB

Active(file): 93796 kB

Inactive(file): 65372 kB

Unevictable: 0 kB

Mlocked: 0 kB

HighTotal: 143304 kB

HighFree: 312 kB

LowTotal: 891108 kB

LowFree: 621228 kB

SwapTotal: 901112 kB

SwapFree: 901024 kB

Dirty: 44 kB

Writeback: 0 kB

AnonPages: 199588 kB

Mapped: 46860 kB

Shmem: 30884 kB

Slab: 15432 kB

SReclaimable: 11172 kB

SUnreclaim: 4260 kB

KernelStack: 816 kB

PageTables: 1732 kB

NFS_Unstable: 0 kB

Bounce: 0 kB

WritebackTmp: 0 kB

CommitLimit: 1418316 kB

Committed_AS: 664480 kB

VmallocTotal: 122880 kB

VmallocUsed: 6168 kB

VmallocChunk: 109124 kB

HardwareCorrupted: 0 kB

HugePages_Total: 0

HugePages_Free: 0

HugePages_Rsvd: 0

HugePages_Surp: 0

Hugepagesize: 4096 kB

DirectMap4k: 16376 kB

DirectMap4M: 888832 kB
Screen Shot 2014-03-27 at 8.24.47 AM.webp
 
BTW, that monitoring service may look cool, but I find it fairly useless....unless I am missing something, it keeps no archives longer than a few hours. In other words, you can't find out what happened even yesterday....or the tendencies over time.....

You'd think it would have many more settings - maybe after beta it will. If it did everything in one place...such as seeing if the server was down, alerts at "x" (ram use, disk use, etc" it would be great.
What I like about it is it is a more compact version of my munin install. If I want to pull up that much data, I'll hit my munin status page. For down and dirty it's handy.
 
Top Bottom