Adam Howard
Well-known member
When it comes to mysql I usually stick to the policy of; if it's not broken, why fix it?! But out of curiosity (or stupidity), I've decided to play around with it a bit. Could use some basic feedback. Server is dedicated, but nothing overly done.
Intel Core2Duo E8300 (2 x 2.83GHz)
4GB DDR2
80GB SATA
This is the default my.conf (currently in use)
This is the one I generated (thanks to Percona)
Thoughts and feedback is always welcome")
Intel Core2Duo E8300 (2 x 2.83GHz)
4GB DDR2
80GB SATA
This is the default my.conf (currently in use)
PHP:
[client]
port=3306
socket=/var/run/mysqld/mysqld.sock

[mysqld_safe]
socket=/var/run/mysqld/mysqld.sock

[mysqld]
user=mysql
pid-file=/var/run/mysqld/mysqld.pid
socket=/var/run/mysqld/mysqld.sock
port=3306
basedir=/usr
datadir=/var/lib/mysql
tmpdir=/tmp
lc-messages-dir=/usr/share/mysql
log_error=/var/log/mysql/error.log
max_connections=200
max_user_connections=30
wait_timeout=30
interactive_timeout=50
long_query_time=5
innodb_file_per_table

!includedir /etc/mysql/conf.d/
This is the one I generated (thanks to Percona)
PHP:
[mysql]

# CLIENT #
port  = 3306
socket  = /var/lib/mysql/mysql.sock

[mysqld]

# GENERAL #
user  = mysql
default-storage-engine  = InnoDB
socket  = /var/lib/mysql/mysql.sock
pid-file  = /var/lib/mysql/mysql.pid

# MyISAM #
key-buffer-size  = 32M
myisam-recover  = FORCE,BACKUP

# SAFETY #
max-allowed-packet  = 16M
max-connect-errors  = 1000000

# DATA STORAGE #
datadir  = /var/lib/mysql/

# BINARY LOGGING #
log-bin  = /var/lib/mysql/mysql-bin
expire-logs-days  = 14
sync-binlog  = 1

# CACHES AND LIMITS #
tmp-table-size  = 32M
max-heap-table-size  = 32M
query-cache-type  = 0
query-cache-size  = 0
max-connections  = 500
thread-cache-size  = 50
open-files-limit  = 65535
table-definition-cache  = 4096
table-open-cache  = 4096

# INNODB #
innodb-flush-method  = O_DIRECT
innodb-log-files-in-group  = 2
innodb-log-file-size  = 128M
innodb-flush-log-at-trx-commit = 2
innodb-file-per-table  = 1
innodb-buffer-pool-size  = 2G

# LOGGING #
log-error  = /var/lib/mysql/mysql-error.log
log-queries-not-using-indexes  = 1
slow-query-log  = 1
slow-query-log-file  = /var/lib/mysql/mysql-slow.log
Thoughts and feedback is always welcome
Last edited:
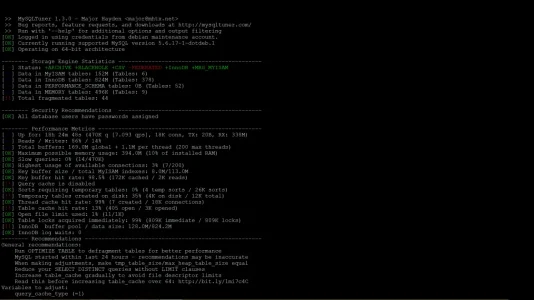
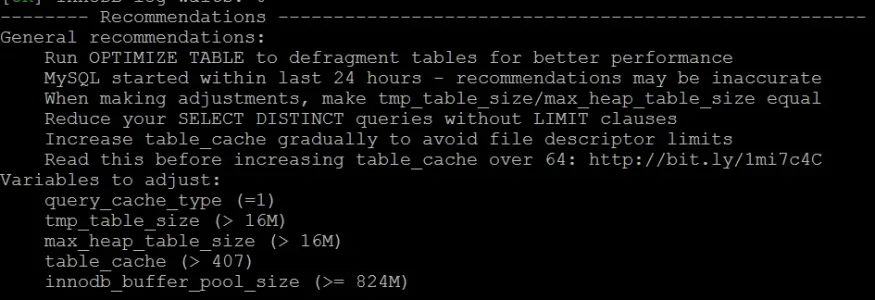
") This is one of the reasons that make me think maybe I should do some tweaking.
This is one of the reasons that make me think maybe I should do some tweaking. 
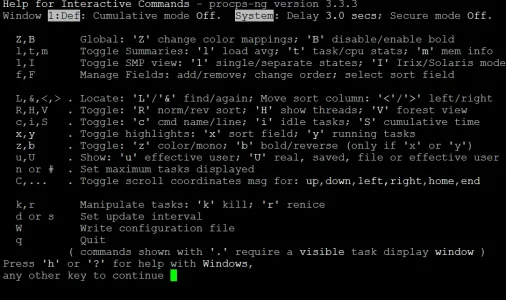
 in this case - no information about peak)
 )
)")