How to: Basic Elasticsearch installation. (RHEL/SUSE)

Slavik

XenForo moderator
Staff member
Basic Elasticsearch Installation (RHEL / SUSE)

@Floren has an amazing repo for RHEL 6 and 7, the Elasticsearch RPM he provides is perfectly set up and currently I suggest using it.

The old manual setup guide can be found below.

Step 1) Install the Axivo Repo: https://www.axivo.com/resources/repository-setup.1/

Step 2) Install ElasticSearch: https://www.axivo.com/resources/elasticsearch-setup.11/


This guide is provided to show how to do a basic (vanilla get up and go) install of Elasticsearch (0.90.0 Beta 1), the Elasticsearch Service Wrapper and the required Java Runtime Environment (JRE) (1.7.0_17) on RHEL / SUSE. This guide will not cover running a dedicated Elasticsearch user.

For Debian/Ubuntu users, a guide can be found here.

This guide assumes the user has basic knowledge of SSH and prior to starting the steps below has logged in as root. This guide also assumes the user does not currently have any JRE installed. You can check if you have JRE installed by typing

Code:
java -version

As of writing, the current file locations for JRE are as follows:

32 bit
Code:
http://download.oracle.com/otn-pub/java/jdk/7u17-b02/jre-7u17-linux-i586.rpm

64 bit
Code:
http://download.oracle.com/otn-pub/java/jdk/7u17-b02/jre-7u17-linux-x64.rpm

The guide will be shown using the 64 bit install, however if you are using a 32 bit system, change the file names as appropriate.

Please note, whilst this is a simple and easy setup, I take no responsibility for any damages or losses that may occur to your system by following the steps below. If you are unsure at any stage, please ask for assistance or seek the help of a qualified Linux Systems Administrator.

Installing the JRE
Type the following commands into your SSH terminal.
Code:
cd /tmp
wget http://download.oracle.com/otn-pub/java/jdk/7u17-b02/jre-7u17-linux-x64.rpm
rpm -ivh jre-7u17-linux-x64.rpm
java -version

Assuming everything was done correctly, you should get the following output.

Code:
# java -version
java version "1.7.0_17"
Java(TM) SE Runtime Environment (build 1.7.0_17)
Java HotSpot(TM) 64-Bit Server VM (build 22.0-b10, mixed mode)

Install Elasticsearch

Code:
cd /
curl -L -O -k https://download.elasticsearch.org/elasticsearch/elasticsearch/elasticsearch-0.90.0.Beta1.zip
unzip elasticsearch-0.90.0.Beta1.zip
mv elasticsearch-0.90.0.Beta1 elasticsearch

Install the Elasticsearch Service Wrapper

Code:
curl -L -k http://github.com/elasticsearch/elasticsearch-servicewrapper/tarball/master | tar -xz
mv *servicewrapper*/service elasticsearch/bin/
elasticsearch/bin/service/elasticsearch install
ln -s `readlink -f elasticsearch/bin/service/elasticsearch` /usr/local/bin/rcelasticsearch
rcelasticsearch start

Assuming everything was done correctly, you should see the following output.

Code:
rcelasticsearch start
Starting ElasticSearch...
Waiting for ElasticSearch......
running: PID: xxxxx

Basic Configuration

You should do some basic configuration of Elasticsearch before installing the addon in XenForo.


1) Open up /elasticsearch/config/elasticsearch.yml and on line 32 edit

Code:
# cluster.name: elasticsearch

To

Code:
cluster.name: PUT-SOMETHING-UNIQUE-HERE

on line 199 edit

Code:
# network.host: 192.168.0.1

to

Code:
network.host: 127.0.0.1

On line 211 edit

Code:
# http.port: 9200

to

Code:
http.port: 9200

Save and Close


2) Open up /elasticsearch/bin/service/elasticsearch.conf on line 2 edit

Code:
set.default.ES_HEAP_SIZE=1024

To a number suitable for the size of your forum.

I reccomend approximately 1 GB for the HEAP_SIZE per 1 million posts on your forum.

1 Million Posts: 1024
2 Million Posts: 2048
3 Million Posts: 3072
4 Million Posts: 4096
etc

This will not mean the service will use all that available memory, however it will have it at its disposal if required.

So for example a 3 Million Post forum would edit

Code:
set.default.ES_HEAP_SIZE=1024

to

Code:
set.default.ES_HEAP_SIZE=3072


Save and Exit.


3) Optional - Move the Elasticsearch data directory.

Your linux install may be configured in such a way that your install partition is only a few Gb in size, and placing a large Elasticsearch index there is not ideal.

In which case you will want to move the index directory to a different, larger, location (in this example /var/elasticsearch)

Code:
cd /var
mkdir elasticsearch

Open up /elasticsearch/config/elasticsearch.yml on line 143 edit

Code:
# path.data: /path/to/data

to

Code:
path.data: /var/elasticsearch

Save and Exit

4) Restart the Elasticsearch Service

In SSH type

Code:
rcelasticsearch restart

You should get the following output

Code:
rcelasticsearch restart
Stopping ElasticSearch...
Stopped ElasticSearch.
Starting ElasticSearch...
Waiting for ElasticSearch......
running: PID: xxxxx

Elasticsearch is now runing with your updated config.


Install the XenForo Enhanced Search Addon

1) Turn your board off into maintainance mode*

2) Download the addon from your customer area at http://xenforo.com/customers/

3) Follow the instructions found at http://xenforo.com/help/enhanced-search/

4) Wait for your indexes to be rebuilt

5) Open your board.

6) Install the index pre-warmer.

As of 0.90.0 Beta an index pre-warmer is available. This keeps your search index "warm" in active memory so when a search is done, the access time latency is highly reduced.

Installing this is simple, in SSH simply run the following replacing the *INDEX NAME* with the name of your ES index.

Code:
curl -XPUT localhost:9200/*INDEX NAME*/_warmer/warmer_1 -d '{
    "query" : {
        "match_all" : {}
    }
}'

You should have the following returned

Code:
{"ok":true,"acknowledged":true}


*You may leave your board open during the re-index process.

Congratulations. Your board should now be running XenForo Enhanced Search.
 
Last edited:
What I would like to know from you guys with the 20m+ forums, what OS are you running on?
I was using SUSE Linux Enterprise until last September. At that point I switched everything over to openSUSE (same underpinnings, but free vs. ~$940/per 3 years, per server, and also not a generation behind).
 
It works now on my CentOS installation:

I set configuration in this section as follow and the search index can be rebuild now:

############################## Network And HTTP ###############################

# ElasticSearch, by default, binds itself to the 0.0.0.0 address, and listens
# on port [9200-9300] for HTTP traffic and on port [9300-9400] for node-to-node
# communication. (the range means that if the port is busy, it will automatically
# try the next port).

# Set the bind address specifically (IPv4 or IPv6):
#
# network.bind_host: 192.168.0.1

# Set the address other nodes will use to communicate with this node. If not
# set, it is automatically derived. It must point to an actual IP address.
#
# network.publish_host: 192.168.0.1

# Set both 'bind_host' and 'publish_host':
#
network.host: 127.0.0.1

# Set a custom port for the node to node communication (9300 by default):
#
# transport.tcp.port: 9300

# Enable compression for all communication between nodes (disabled by default):
#
# transport.tcp.compress: true

# Set a custom port to listen for HTTP traffic:
#
http.port: 9200

# Set a custom allowed content length:
#
# http.max_content_length: 100mb

# Disable HTTP completely:
#
# http.enabled: false

In addition I asked my server management to open port 9200 (before I started this thread), I am unsure if this was necessary.
 
Well, i followed the RHEL/SUSE install instructions in this thread. Do i really need to do that? If so, how do i make a script?

If you ran the "elasticsearch/bin/service/elasticsearch install" command it should start automatically on boot, which, if it isn't would suggest a server configuration or installation error.
 
Curious are Elastic Search's memory requirements still as large as what Floren/Shawn etc have discussed in the older posts on this thread ? max 1GB per 1 million posts ?
 
Curious are Elastic Search's memory requirements still as large as what Floren/Shawn etc have discussed in the older posts on this thread ? max 1GB per 1 million posts ?

Custom mapping seems to be able to reduce it from between 1/4 to 1/2 depending on your board.
 
Still pretty hefty for a 30 m post forum, but reduced from 30GB to 8-15GB still nice
Isn't that custom mapping designed to produce slow output results? I'm trying to understand what the "store" part does:
"message" : {"type" : "string", "store" : "no"}
The idea of storing the strings into memory is to allow a quick search through them based on the original search query and avoid a warm-up. You search for specific keywords into "message" string (for example), they are processed through advanced search and a number of ID's is returned.

I was wondering if anyone can post some comparative results between the full memory index usage and a custom mapping one. Testing the IGN search shows their results pulled in average between 2 and 3 seconds.

http://xenforo.com/community/threads/how-to-apply-custom-mapping.31103/#post-355331
 
I'm sorry but that post does not answers my question. It does not say anything about the memory usage or how data is stored. From my experience, you can either store the data on disk or memory. The "store" condition means you store it on disk or memory? The data has to be stored somewhere, orelse how can you search it?

The moment you store the data on disk, Elastic will need a warm-up and produce slow results. If has been confirmed by many, including the Elastic developers.
 
http://www.elasticsearch.org/guide/reference/index-modules/store.html
Simple FS

The simplefs type is a straightforward implementation of file system storage (maps to Lucene SimpleFsDirectory) using a random access file. This implementation has poor concurrent performance (multiple threads will bottleneck). Its usually better to use the niofs when you need index persistence.
NIO FS

The niofs type stores the shard index on the file system (maps to Lucene NIOFSDirectory) using NIO. It allows multiple threads to read from the same file concurrently. It is not recommended on Windows because of a bug in the SUN Java implementation.
MMap FS

The mmapfs type stores the shard index on the file system (maps to Lucene MMapDirectory) by mapping a file into memory (mmap). Memory mapping uses up a portion of the virtual memory address space in your process equal to the size of the file being mapped. Before using this class, be sure your have plenty of virtual address space.

dunno if that helps
 
I'm sorry but that post does not answers my question. It does not say anything about the memory usage or how data is stored. From my experience, you can either store the data on disk or memory. The "store" condition means you store it on disk or memory? The data has to be stored somewhere, orelse how can you search it?

The moment you store the data on disk, Elastic will need a warm-up and produce slow results. If has been confirmed by many, including the Elastic developers.

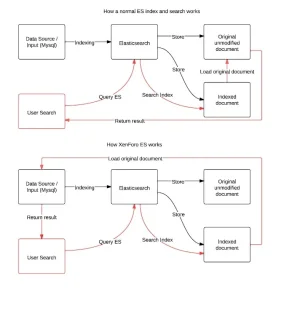
When a document is indexed under default settings an extra field is created in the index which stores that original document alongside the indexed content in case it is required (in most cases, this would be used to return and show the actual search result).

XenForo does not opperate the search like this, instead the search queries the content as per normal and then ES returns the content id which is then shown from the database and not the document from ES. As this document is never used it is effectively dead data, and thus by removing it you aim to reduce the index size on disk (and in turn, when the files are opened and stored in memory, reduce the memory requirement)

Nothing actually happens in effect to "how" ES is working for XenForo, the ES instance still works as before, we are just removing unused information.

I threw this together, maybe it will help you visualise it in a simple way.

flow.webp

As you can see, the XenForo search doesn't require that original document to be stored. All the mapping does is chop off that extra.
 
When a document is indexed under default settings an extra field is created in the index which stores that original document alongside the indexed content in case it is required (in most cases, this would be used to return and show the actual search result).
Thanks, now I understand. So by default Elastic adds twice the same document data, one is for searching and one for returning the actual document in case is needed.
As you can see, the XenForo search doesn't require that original document to be stored. All the mapping does is chop off that extra.
Now, how do we measure the performance and hardware needs? By reading other users experiences, the number of documents implies twice the size of the memory. For example 500k posts will require 1GB of ram, 700k posts 1.4GB, etc. But that is not accurate at all, documents are not equal in size. The custom mapping will eliminate a portion of the memory usage so we end-up with what in real life? You cannot guess on that area, so it has to be a real factor calculator that allows you to determine precisely the memory usage.

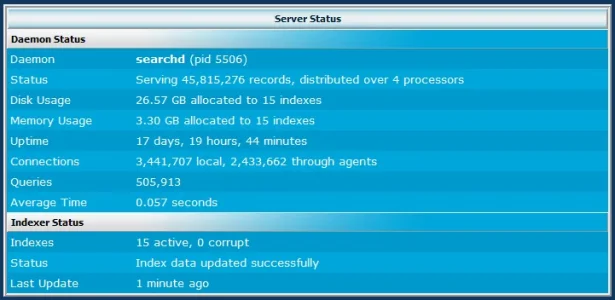
For example, on Sphinx is very easy. All you have to do is sum the total size of all indices that are stored into memory and you know for sure the actual memory usage:

memory.webp

In my example for 46 million posts, 3.3GB of RAM are used to produce index results extracted in 0.057 seconds.
It has to be a method that allows us to be very precise in determining the memory used. A large forum cannot "guess", it has to take into consideration all factors before they might end-up with outrageous new hardware requirements.

I talk about memory storage a lot because it seems is the ONLY direction that is viable for Elastic, in order to produce proper search results in a fashionable time. Storing the data into disk will simply produce undesirable slow results. And since the memory data is volatile, what happens if I reboot the server? How long does it takes for memory indices to rebuilt? Is the index data created locally as file and then its contents stored into memory?
 
A large forum cannot "guess", it has to take into consideration all factors before they might end-up with outrageous new hardware requirements.

I talk about memory storage a lot because it seems is the ONLY direction that is viable for Elastic, in order to produce proper search results in a fashionable time. Storing the data into disk will simply produce undesirable slow results. And since the memory data is volatile, what happens if I reboot the server? How long does it takes for memory indices to rebuilt? Is the index data created locally as file and then its contents stored into memory?

This is the part a few of us are trying to work out, factors effecting index sizes and speed and attempting to work out a requirement, having said that the 1gb/million posts seems like a reasonable enough starting point and any custom mapping reducing that requirement is a bonus... but for the time being it seems more like a "suck it and see" aproach is the only way to get those answers.

Es indexes are written to disk as files within the /es/data directory, when a file is requested it is loaded into memory (at which point it remains open for a period of time before being closed) unless you specifically set the storage type to memory in which case the indexes are exclusively indexed and stored to your servers memory with the associated risks of doing so and hence why some of us are using a little bash script to randomly load search terms to maintain the files in active memory to speed up searches.


So can you post the memory usage on indices?

DP is releasing an addon, theres a nice pretty UI you can find on github (https://github.com/mobz/elasticsearch-head) or more simply hit this in and work out the numbers yourself, also remember memory usage is linked to user load. :)

Code:
 curl -XGET 'http://localhost:9200/_cluster/nodes/stats?pretty=true'


Code:
curl -XGET 'http://localhost:9200/_cluster/nodes/stats?pretty=true'
{
  "cluster_name" : "testbedES",
  "nodes" : {
    "myP4CtBhRLOH3BB1NtDYUw" : {
      "name" : "Stardust",
      "indices" : {
        "store" : {
          "size" : "948mb",
          "size_in_bytes" : 994055264
        },
        "docs" : {
          "count" : 1317585,
          "deleted" : 2472
        },
        "indexing" : {
          "index_total" : 8749,
          "index_time" : "1.4m",
          "index_time_in_millis" : 85390,
          "index_current" : 0,
          "delete_total" : 84,
          "delete_time" : "855ms",
          "delete_time_in_millis" : 855,
          "delete_current" : 0
        },
        "get" : {
          "total" : 0,
          "time" : "0s",
          "time_in_millis" : 0,
          "exists_total" : 0,
          "exists_time" : "0s",
          "exists_time_in_millis" : 0,
          "missing_total" : 0,
          "missing_time" : "0s",
          "missing_time_in_millis" : 0,
          "current" : 0
        },
        "search" : {
          "query_total" : 139160,
          "query_time" : "1.5h",
          "query_time_in_millis" : 5475259,
          "query_current" : 0,
          "fetch_total" : 103345,
          "fetch_time" : "4.8h",
          "fetch_time_in_millis" : 17426649,
          "fetch_current" : 0
        },
        "cache" : {
          "field_evictions" : 0,
          "field_size" : "15mb",
          "field_size_in_bytes" : 15823076,
          "filter_count" : 6,
          "filter_evictions" : 0,
          "filter_size" : "826kb",
          "filter_size_in_bytes" : 845824
        },
        "merges" : {
          "current" : 0,
          "current_docs" : 0,
          "current_size" : "0b",
          "current_size_in_bytes" : 0,
          "total" : 1,
          "total_time" : "86ms",
          "total_time_in_millis" : 86,
          "total_docs" : 19,
          "total_size" : "38.9kb",
          "total_size_in_bytes" : 39885
        },
        "refresh" : {
          "total" : 8632,
          "total_time" : "1.2m",
          "total_time_in_millis" : 74320
        },
        "flush" : {
          "total" : 5155,
          "total_time" : "9.3m",
          "total_time_in_millis" : 562688
        }
      },
      "os" : {
        "timestamp" : 1336296997532,
        "uptime" : "515 hours, 52 minutes and 41 seconds",
        "uptime_in_millis" : 1857161000,
        "load_average" : [ 0.46, 0.35, 0.33 ],
        "cpu" : {
          "sys" : 2,
          "user" : 3,
          "idle" : 93
        },
        "mem" : {
          "free" : "5.3gb",
          "free_in_bytes" : 5727977472,
          "used" : "2.4gb",
          "used_in_bytes" : 2622029824,
          "free_percent" : 77,
          "used_percent" : 22,
          "actual_free" : "6gb",
          "actual_free_in_bytes" : 6451220480,
          "actual_used" : "1.7gb",
          "actual_used_in_bytes" : 1898786816
        },
        "swap" : {
          "used" : "11.9mb",
          "used_in_bytes" : 12550144,
          "free" : "3.7gb",
          "free_in_bytes" : 4001366016
        }
      },
      "process" : {
        "timestamp" : 1336296997533,
        "open_file_descriptors" : 585,
        "cpu" : {
          "percent" : 0,
          "sys" : "5 minutes, 38 seconds and 720 milliseconds",
          "sys_in_millis" : 338720,
          "user" : "14 minutes, 35 seconds and 220 milliseconds",
          "user_in_millis" : 875220,
          "total" : "20 minutes, 13 seconds and 940 milliseconds",
          "total_in_millis" : 1213940
        },
        "mem" : {
          "resident" : "596.9mb",
          "resident_in_bytes" : 625917952,
          "share" : "11mb",
          "share_in_bytes" : 11628544,
          "total_virtual" : "4.5gb",
          "total_virtual_in_bytes" : 4902260736
        }
      },
      "jvm" : {
        "timestamp" : 1336296997533,
        "uptime" : "515 hours, 46 minutes, 22 seconds and 165 milliseconds",
        "uptime_in_millis" : 1856782165,
        "mem" : {
          "heap_used" : "238.2mb",
          "heap_used_in_bytes" : 249812744,
          "heap_committed" : "509.9mb",
          "heap_committed_in_bytes" : 534708224,
          "non_heap_used" : "36.9mb",
          "non_heap_used_in_bytes" : 38785000,
          "non_heap_committed" : "57.7mb",
          "non_heap_committed_in_bytes" : 60506112
        },
        "threads" : {
          "count" : 41,
          "peak_count" : 63
        },
        "gc" : {
          "collection_count" : 9209,
          "collection_time" : "34 seconds and 935 milliseconds",
          "collection_time_in_millis" : 34935,
          "collectors" : {
            "ParNew" : {
              "collection_count" : 9191,
              "collection_time" : "34 seconds and 750 milliseconds",
              "collection_time_in_millis" : 34750
            },
            "ConcurrentMarkSweep" : {
              "collection_count" : 18,
              "collection_time" : "185 milliseconds",
              "collection_time_in_millis" : 185
            }
          }
        }
      },
      "network" : {
        "tcp" : {
          "active_opens" : 76254,
          "passive_opens" : 8693590,
          "curr_estab" : 19,
          "in_segs" : 260179338,
          "out_segs" : 121374258,
          "retrans_segs" : 1126081,
          "estab_resets" : 31153,
          "attempt_fails" : 11703,
          "in_errs" : 0,
          "out_rsts" : 38940
        }
      },
      "transport" : {
        "server_open" : 7,
        "rx_count" : 0,
        "rx_size" : "0b",
        "rx_size_in_bytes" : 0,
        "tx_count" : 0,
        "tx_size" : "0b",
        "tx_size_in_bytes" : 0
      },
      "http" : {
        "current_open" : 1,
        "total_opened" : 35904
      }
    }
  }
}
 
Top Bottom