>> MySQLTuner 1.2.0 - Major Hayden <
major@mhtx.net>
>> Bug reports, feature requests, and downloads at
http://mysqltuner.com/
>> Run with '--help' for additional options and output filtering
-------- General Statistics --------------------------------------------------
[--] Skipped version check for MySQLTuner script
[OK] Currently running supported MySQL version 5.0.77-log
[OK] Operating on 64-bit architecture
-------- Storage Engine Statistics -------------------------------------------
[--] Status: -Archive -BDB -Federated +InnoDB -ISAM -NDBCluster
[--] Data in MyISAM tables: 13G (Tables: 5533)
[--] Data in InnoDB tables: 3G (Tables: 145)
[--] Data in MEMORY tables: 2M (Tables: 15)
[!!] Total fragmented tables: 373
-------- Security Recommendations -------------------------------------------
[OK] All database users have passwords assigned
-------- Performance Metrics -------------------------------------------------
[--] Up for: 51d 10h 39m 9s (1B q [303.673 qps], 72M conn, TX: 20574B, RX: 311B)
[--] Reads / Writes: 77% / 23%
[--] Total buffers: 4.9G global + 1.5M per thread (2048 max threads)
[OK] Maximum possible memory usage: 7.9G (33% of installed RAM)
[OK] Slow queries: 0% (16K/1B)
[OK] Highest usage of available connections: 22% (462/2048)
[OK] Key buffer size / total MyISAM indexes: 512.0M/5.3G
[OK] Key buffer hit rate: 100.0% (251B cached / 23M reads)
[OK] Query cache efficiency: 64.6% (617M cached / 955M selects)
[!!] Query cache prunes per day: 571695
[OK] Sorts requiring temporary tables: 5% (8M temp sorts / 149M sorts)
[!!] Joins performed without indexes: 158904
[OK] Temporary tables created on disk: 5% (4M on disk / 94M total)
[OK] Thread cache hit rate: 99% (863 created / 72M connections)
[!!] Table cache hit rate: 14% (8K open / 59K opened)
[OK] Open file limit used: 31% (13K/43K)
[OK] Table locks acquired immediately: 99% (981M immediate / 983M locks)
[OK] InnoDB data size / buffer pool: 3.8G/4.0G
-------- Recommendations -----------------------------------------------------
General recommendations:
Run OPTIMIZE TABLE to defragment tables for better performance
Adjust your join queries to always utilize indexes
Increase table_cache gradually to avoid file descriptor limits
Variables to adjust:
query_cache_size (> 128M)
join_buffer_size (> 512.0K, or always use indexes with joins)
table_cache (> 20480)

")
 and whilst my server load has gone up a fraction of a %, to be honest the site feels quick as before... if not quicker
")
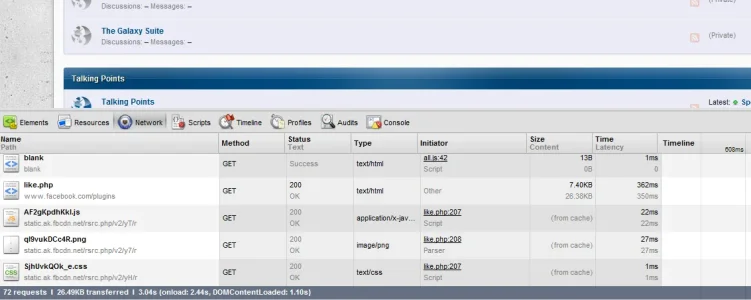
 I'd look into reducing your page size and requests.
