How does ES use RAM? Speccing new server.

RobParker

Well-known member
I was hoping someone could give me a quick answer.

Our hosts (Nimbus, who are excellent) are looking to move us to a new server but it'd have less memory.

I'm a little confused on how this would impact ES.

Our live stats show:
KiB Mem : 32652304 total, 5929716 free, 9955640 used, 16766948 buff/cache

I thought a lot of this buffer/cache was ES but our hosts said that ES is using only 6% of the memory (so around 2GB):
PID USER %MEM COMMAND
22671 elastic+ 6.3

In the XF admin page I see:
Documents 7,749,372 (5.6 GB)
Index updates 1,882,146
Searches 4,210,905 (7 milliseconds average)
Allocated memory 7.3 MB

Based on the above, would 24GB of RAM on a new server be sufficient? What memory is ES actually using here?
 
The official recommendations are 50% of the machine's memory, and a max heap size of ~31gb. So with 24gb of ram, a max heap of 12gb in size.

ElasticSearch's bottlenecks are largely disk performance once you have "enough" memory, which is much lower than you'ld expect. You really want to be using SSDs or NVMe SSDs.

For SpaceBattles; it is using a 3-node elasticsearch cluster using a max of 2gb ram each on NVMe SSDs, which handles the entire site just fine. Using ElasticSearch Essentials's multi-threaded search indexer, and 20 workers (running on 16 cores); it can index the entire site's ~52 million documents in ~25 minutes without noticeable impact to the site's performance.

I thought a lot of this buffer/cache was ES but our hosts said that ES is using only 6% of the memory (so around 2GB):
The default max heap size needs tuning as by default on older versions it has fixed heap size(1gb or 2gb!). Very new version try to automatically set the max heap size.
 
Thanks guys! New server would be fast SSDs, etc but my concern was that it was less memory on paper that we're currently using but I'm not really clear if ES is actually using that memory or not. I thought it was but now I'm not sure. We currently have around 8 million posts if that info's useful.

It sounds like the 16GB of buffer/cache that's being used isn't due to ES (and I thought it was)?
 
Xon hits the nail on the head saying the memory needs are lower than you'd expect. My own 4 "big boards" have less then 2GB combined set aside for ES, and I could get away with less, but the server has lots of ram to spare. Several clients with large 10 - 50+ million posts, and one with a combined 100+ million, the ES memory use is similar per million posts.

Consider that on average 80% of searches are going to hit about 20% of the index, so you don't need to worry about the entire index fitting in ram. Even in the case of misses the index portion loaded might be a few milliseconds at most (or microseconds if it's in disk cache).
 
At Our forum that has a ~7gb database of posts, we are using 11gb of memory on a 16gb system. On a 8gb system with 6.5gb free ( IE not part of disk caching ), elasticsearch completely fails to boot.

I have another client running Magento 2.4.x and it consumes a fixed amount of memory also, that machine has to have 32gb of ram due to elasticsearch; previously they were running Magento 2 with 8gb of ram until we added elasticsearch.

So i would not agree that elasticsearch's memory usage = ~50% ram. They say that in the documentation, but it isn't true.

That being said, any tips on how to tune the memory utilization of elasticsearch? I've tried on the magento system but Elasticsearch doesn't seem to have the configurability. I feel like i am missing something.
 
Are you setting the heap size for Elastic Search? Its in the JVM options file in /etc/elasticsearch. You can limit it's RAM use that way. Set it to about 20% of the total search index size. Let the disk cache do the rest. Don't forget to restart ES.

If you don't set it, ES will use as much RAM as it needs to load the entire index in.
 
This is an interesting foot-gun.

By default, glibc allocates a new 128 MB malloc arena for every thread (up to a certain limit, by default 8 * processor count)

This is memory outside of the java max heap size.

Setting MALLOC_ARENA_MAX to a low-ish value can be done without changing existing files/packages.

This creates a systemd override file, and then makes it apply to elasticsearch
Code:
mkdir /etc/systemd/system/elasticsearch.service.d/

cat > /etc/systemd/system/elasticsearch.service.d/glibc_fix.conf <<EOL
[Service]
Environment="MALLOC_ARENA_MAX=4"
EOL

systemctl daemon-reload && systemctl restart elasticsearch
 
Last edited:
Some clarifications:
  1. ES needs you to keep a big chunk of RAM free so that the kernel can use it as a filesystem cache. That's "buff/cache" in the first post.
  2. The recommendation to set the heap size to half your RAM assumes that you have a system that's just running ES, and that you have a significant amount of RAM (typically at least 16 GiB). ES is optimized for a situation in which roughly half the RAM gets allocated to its heap, and the other half stays "free" and is used by the kernel as a filesystem cache. If you're running with less RAM, or ES is on the same system as other servers, you'll need to adjust your calculations accordingly, and you'll need to make sure you always keep a big chunk of RAM free (or, depending on the tool you're using to measure memory usage, allocated to the kernel's buffer/cache).
  3. MALLOC_ARENA_MAX affects virtual memory usage, not necessarily physical memory usage. It's fine for virtual memory usage to be high as long as the GC does its job and minimizes fragmentation. Depending on the workload, JRE, or GC implementation, that may not happen correctly. It's best to leave MALLOC_ARENA_MAX alone, but if you're really tight on RAM, you can try messing with it. I'd tinker with other parameters first, though.
  4. The higher the latency or throughput on your storage medium, the more RAM you'll need to keep available to the kernel for caching. If you upgrade from a spinning disk to an SSD, you can likely get away with less free RAM, especially for a read-heavy workload like XenForo.
  5. On a system that's just running ES, there's no point in having a chunk of free memory that significantly exceeds your index size. If the same system is also running, say, MySQL, you'd need to sum your ES index size and your MySQL DB size (on-disk) to get the maximum useful free memory.
If you're also using your Elasticsearch cluster for heavier workloads--e.g., logging and monitoring--some of this advice goes out the window, and you'll probably just need a lot of RAM. And patience.
 
Allright so here's the deal.
We set the heap size to 8gb and it makes our search performance unacceptably slow. bare minimum for fast performance is 12gb of memory on our ~7 million post forum.
So, less ram = more CPU usage.

But this is exactly half our memory.

We end up with 4gb of overhead in a system with 16gb.
Search performance is much worse with elasticsearch/xenforo as a combo versus phpBB where we comfortably ran on a 4gb machine.
This is on 2x 3.5ghz cores

We also have another problem.
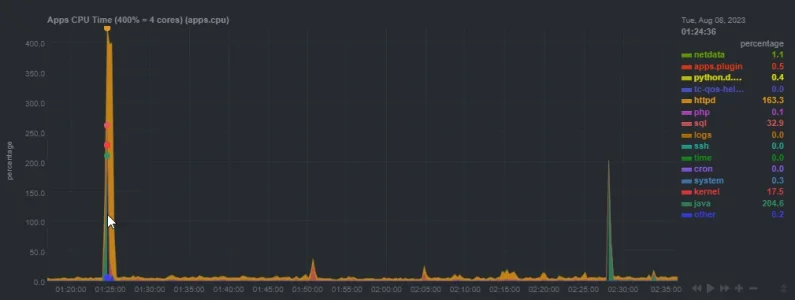
Elasticsearch somewhat randomly initiates a geoIP database update which causes all cores to be locked up for a good period of time, this causes apache requests to back up, we run out of memory, and then the elasticsearch process doesn't automatically reset itself after being killed by the OOM-killer.

Elasticsearch log says this at the time of the blowout:

1691701441940.webp

Previously i put a nightly reboot of the elasticsearch process in cron to fight back memory leaks, however a long memory leak is not our problem, it's elasticsearch exhausting periodically exhausting our resources during a geoIP update.

Here is the sequence of events where the elasticsearch causes a resource blowout:

1691700825615.webp

We have extremely good DDOS protection so excess HTTP calls is not the issue ( i double checked ).

I have modified the systemd file to try to restart elasticsearch when it blows up.. but yeah.. it is not stable.

Any ideas on how to get elasticsearch to stop blowing up? I really don't want to double my hosting bill the second time just to handle this random yet intense spike of resource usage.
 
For the record, i have this issue also with a magento setup for another client; the fix is 2x automatic elasticsearch reboots per day; i think there may also be a geoIP database in play on that system too but haven't scoped it out as much as the problem on the Xenforo setup.
 
Last edited:
XFES doesn't use Elasticsearch's GeoIP features. If you're exclusively using XFES (and not putting, say, access logs in Elasticsearch), you can simply disable GeoIP updates.
 
Allright so here's the deal.
We set the heap size to 8gb and it makes our search performance unacceptably slow. bare minimum for fast performance is 12gb of memory on our ~7 million post forum.
So, less ram = more CPU usage.

But this is exactly half our memory.

We end up with 4gb of overhead in a system with 16gb.
Search performance is much worse with elasticsearch/xenforo as a combo versus phpBB where we comfortably ran on a 4gb machine.
This is on 2x 3.5ghz cores

We also have another problem.
Elasticsearch somewhat randomly initiates a geoIP database update which causes all cores to be locked up for a good period of time, this causes apache requests to back up, we run out of memory, and then the elasticsearch process doesn't automatically reset itself after being killed by the OOM-killer.

Elasticsearch log says this at the time of the blowout:

View attachment 289758

Previously i put a nightly reboot of the elasticsearch process in cron to fight back memory leaks, however a long memory leak is not our problem, it's elasticsearch exhausting periodically exhausting our resources during a geoIP update.

Here is the sequence of events where the elasticsearch causes a resource blowout:

View attachment 289757

We have extremely good DDOS protection so excess HTTP calls is not the issue ( i double checked ).

I have modified the systemd file to try to restart elasticsearch when it blows up.. but yeah.. it is not stable.

Any ideas on how to get elasticsearch to stop blowing up? I really don't want to double my hosting bill the second time just to handle this random yet intense spike of resource usage.

That's odd. Typically, a very small number of keywords account for more than 95% of searches, and once that's cached they should be lightning fast. Even cache misses shouldn't be much slower, in my experience.
 
That's odd. Typically, a very small number of keywords account for more than 95% of searches, and once that's cached they should be lightning fast. Even cache misses shouldn't be much slower, in my experience.
I've seen some 3rd party add-ons which push a complex query to elasticsearch on every page load, this can quickly cause performance issues
 
Top Bottom