Elasticsearch Server Impact Thread

Slavik

XenForo moderator
Staff member
Right, so people are slowly working their way to Elasticsearch, and besides myself and Deebs we don't have many stats out there.

So, the idea of this thread is to see the impact of the search on the server.

To find out the file size on disk, navigate to your elasticsearch index directory (/var/elasticsearch if you followed the guide in this forum) and run "du -ach"

www.p8ntballer-forums.com
Posts Indexed: ~1.2 million
Size on Disk: 925M Total
Min/Max Ram Allocated in config: 512mb/2048mb

http://forums.freddyshouse.com/
Posts Indexed: ~4 million
Size of Disk: 2.9GB Total
MinMax Ram Allocated in config: 4096mb/4096mb
 
Slavik,

My settings:

bootstrap.mlockall: true
index.store.type: mmapfs
Min: 4g
Max:4g
Max Open Files: 65500 (for the process running Java/ES)
 
Sounds like ElasticSearch indices are roughly twice as large as Sphinx, but still fairly small. How short is the ElasticSearch min word length? IIRC, it only has a handful of words it *doesn't* index... so the single letter queries may account for the bulk of the index difference.
 
Sounds like ElasticSearch indices are roughly twice as large as Sphinx, but still fairly small. How short is the ElasticSearch min word length? IIRC, it only has a handful of words it *doesn't* index... so the single letter queries may account for the bulk of the index difference.

No minimum length.
 
I've got ES installed on my test system and to be honest, it's really struggling due to lack of memory.

Posts Indexed: 9.3 million
Size on Disk: 8.8GB
MinMax RAM allocated: 768mb/1GB

I don't think it's going to be realistic to run ES on our current live system until I can get a server with more RAM.
Sphinx works fine on both the test system and the live system, but the SphinxSearch add-on doesn't handle the changes to search in 1.1.x so we're stuck at 1.0.4 until either the add-on gets updated, I learn enough to update it myself or we get enough extra RAM to support ES.

Because ES needs XF 1.1.1, I can't easily go live with it as I can't then fall back to Sphinx if it doesn't work on our hardware.

Probably the incentive we need to try to scrape together a server with more RAM.
What are the specs of your existing server? Can you run free -m and paste the results? (Live server that is :))
 
What are the specs of your existing server? Can you run free -m and paste the results? (Live server that is :))
The server specs are :
CPU: Intel Quad Core Q9300 @ 2.50GHz
RAM: 4GB
OS: FreeBSD 7.2
Disks: Adaptec-controlled RAID1 pair of 150GB WD Raptor SATA drives

We don't do "free" on FreeBSD :)

From a "top -d1"
Mem: 2253M Active, 717M Inact, 758M Wired, 56M Cache, 418M Buf, 153M Free

So running pretty tight. I could drop the memory and buffers that MySQL has access to but that's not going to help general performance.
(We're an example of how well XenForo works on very limited hardware - see my sig for more info)
Sorry didn't realise you were on FreeBSD. When you say it is struggling what symptons are you seeing? Even on my setup with 4gb allocated I have to warm the ES cache.
 
Sorry didn't realise you were on FreeBSD. When you say it is struggling what symptons are you seeing? Even on my setup with 4gb allocated I have to warm the ES cache.
Searches taking 6 or 7 seconds to come back (though the page shows Timing: 0.1687 seconds).
Much faster once cached, obviously.

It does seem to have settled down a bit since I bumped up the ES_MIN_MEM to 768mb, as before that I was getting "search failed, try again later"
 
It does seem to have settled down a bit since I bumped up the ES_MIN_MEM to 768mb, as before that I was getting "search failed, try again later"
Failed searches should be logged, so if you can have a look at your server error log in the admin CP, that'd be helpful.
 
Searches taking 6 or 7 seconds to come back (though the page shows Timing: 0.1687 seconds).
Much faster once cached, obviously.

It does seem to have settled down a bit since I bumped up the ES_MIN_MEM to 768mb, as before that I was getting "search failed, try again later"
I would also activate the slowlog feature of ES to gain a better understanding of what is happening. Out of interest, standard ES install? 1 replica and 5 shards? and default settings in elasticsearch.yml?
 
Finally run the following:
curl -XGET 'http://<ip ES is bound to>:9200/_cluster/nodes/stats'

and look for field_evictions/filter_evictions. If they are greater than zero then you are memory constrained. For comparison here is my output:

{
  • name: Herr Kleiser
  • indices: {
    • store: {
      • size: 5.9gb
      • size_in_bytes: 6339936376
      }
    • docs: {
      • count: 8086488
      • deleted: 14
      }
    • indexing: {
      • index_total: 4165955
      • index_time: 47m
      • index_time_in_millis: 2822597
      • index_current: 0
      • delete_total: 11
      • delete_time: 47ms
      • delete_time_in_millis: 47
      • delete_current: 0
      }
    • get: {
      • total: 0
      • time: 0s
      • time_in_millis: 0
      • exists_total: 0
      • exists_time: 0s
      • exists_time_in_millis: 0
      • missing_total: 0
      • missing_time: 0s
      • missing_time_in_millis: 0
      • current: 0
      }
    • search: {
      • query_total: 1270644
      • query_time: 54.3m
      • query_time_in_millis: 3258041
      • query_current: 0
      • fetch_total: 323292
      • fetch_time: 47.5m
      • fetch_time_in_millis: 2854235
      • fetch_current: 0
      }
    • cache: {
      • field_evictions: 0
      • field_size: 46.1mb
      • field_size_in_bytes: 48423196
      • filter_count: 2
      • filter_evictions: 0
      • filter_size: 698.3kb
      • filter_size_in_bytes: 715080
      }
    • merges: {
      • current: 0
      • current_docs: 0
      • current_size: 0b
      • current_size_in_bytes: 0
      • total: 820
      • total_time: 18.1m
      • total_time_in_millis: 1087863
      • total_docs: 11544105
      • total_size: 8.9gb
      • total_size_in_bytes: 9558179430
      }
    • refresh: {
      • total: 7700
      • total_time: 11.9m
      • total_time_in_millis: 718504
      }
    • flush: {
      • total: 1693
      • total_time: 12.1m
      • total_time_in_millis: 731788
      }
    }
  • os: {
    • timestamp: 1326996117563
    • uptime: 2426 hours, 57 minutes and 19 seconds
    • uptime_in_millis: 8737039000
    • load_average: [
      • 0.37
      • 0.39
      • 0.44
      ]
    • cpu: {
      • sys: 1
      • user: 5
      • idle: 92
      }
    • mem: {
      • free: 44mb
      • free_in_bytes: 46174208
      • used: 13.7gb
      • used_in_bytes: 14725758976
      • free_percent: 24
      • used_percent: 75
      • actual_free: 3.4gb
      • actual_free_in_bytes: 3660201984
      • actual_used: 10.3gb
      • actual_used_in_bytes: 11111731200
      }
    • swap: {
      • used: 20.2mb
      • used_in_bytes: 21262336
      • free: 7.9gb
      • free_in_bytes: 8568664064
      }
    }
  • process: {
    • timestamp: 1326996117564
    • open_file_descriptors: 129
    • cpu: {
      • percent: 1
      • sys: 9 minutes, 10 seconds and 510 milliseconds
      • sys_in_millis: 550510
      • user: 2 hours, 1 minute, 53 seconds and 390 milliseconds
      • user_in_millis: 7313390
      • total: 2 hours, 11 minutes, 3 seconds and 900 milliseconds
      • total_in_millis: 7863900
      }
    • mem: {
      • resident: 5.3gb
      • resident_in_bytes: 5792182272
      • share: 971mb
      • share_in_bytes: 1018191872
      • total_virtual: 10.7gb
      • total_virtual_in_bytes: 11538997248
      }
    }
  • jvm: {
    • timestamp: 1326996117565
    • uptime: 51 hours, 24 minutes, 37 seconds and 802 milliseconds
    • uptime_in_millis: 185077802
    • mem: {
      • heap_used: 1.9gb
      • heap_used_in_bytes: 2041314440
      • heap_committed: 3.9gb
      • heap_committed_in_bytes: 4286251008
      • non_heap_used: 40.7mb
      • non_heap_used_in_bytes: 42713840
      • non_heap_committed: 63.2mb
      • non_heap_committed_in_bytes: 66342912
      }
    • threads: {
      • count: 46
      • peak_count: 71
      }
    • gc: {
      • collection_count: 6110
      • collection_time: 2 minutes, 47 seconds and 995 milliseconds
      • collection_time_in_millis: 167995
      • collectors: {
        • ParNew: {
          • collection_count: 6107
          • collection_time: 2 minutes, 47 seconds and 907 milliseconds
          • collection_time_in_millis: 167907
          }
        • ConcurrentMarkSweep: {
          • collection_count: 3
          • collection_time: 88 milliseconds
          • collection_time_in_millis: 88
          }
        }
      }
    }
  • network: {
    • tcp: {
      • active_opens: 1067983
      • passive_opens: 6414099
      • curr_estab: 24
      • in_segs: 576340737
      • out_segs: 293464379
      • retrans_segs: 397936
      • estab_resets: 224749
      • attempt_fails: 4031
      • in_errs: 1262
      • out_rsts: 256230
      }
    }
  • transport: {
    • server_open: 7
    • rx_count: 0
    • rx_size: 0b
    • rx_size_in_bytes: 0
    • tx_count: 0
    • tx_size: 0b
    • tx_size_in_bytes: 0
    }
  • http: {
    • current_open: 4
    • total_opened: 255433
    }
}
 
Failed searches should be logged, so if you can have a look at your server error log in the admin CP, that'd be helpful.
When I looked earlier they were along the lines of "elastic search seems have gone away". On my phone now so tricky to check.
I would also activate the slowlog feature of ES to gain a better understanding of what is happening. Out of interest, standard ES install? 1 replica and 5 shards? and default settings in elasticsearch.yml?
Yeah, pretty much a standard install. I didn't change any shard or replica numbers. Just changed the min/max memory env. variables
(Test system is Ubuntu for various reasons).

I'll be trying some more tweaking and tuning when I get some spare time.

It's not a massive issue really as we've been pushing things at the edge for a while, and it might be feasible yet.
 
Great stuff Anthony. How have your users noticed the change?
They aren't really web savvy I guess... more general users, though I certainly have no doubt they will enjoy being able to now search for 3 letter words and such... which was one thing that used to annoy me deeply with MySQL... even though I could have changed the default settings, I didn't want to make my DB search table any bigger by that move.

Hopefully they will provide feedback over time... though I am extremely impressed with the search functionality already.

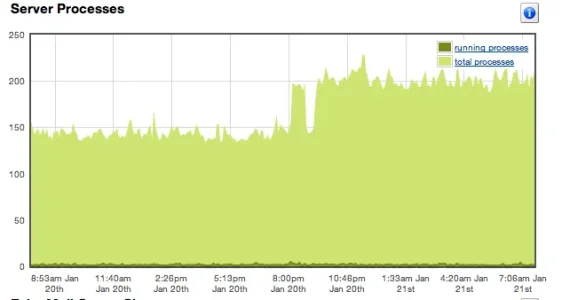
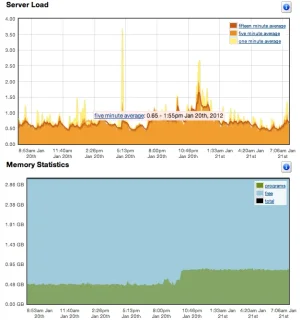
Thanks for sharing those graphs, Anthony! Are they generated by NewRelic?
No idea to be perfectly honest... Wiredtree server graphs. I did read "proprietary client portal," so not sure if that means made for them or not.
 
Bit of an update. We managed to get another 4GB RAM for the server taking it to 8GB.
As a result I upgraded our live system to XF 1.1.1 and installed XFES.

So far it's been running nicely, as far as I can tell. Have a min/max of 1G/3G for the time being.

The ES index is 8.8GB which is slightly more than twice the size of the Sphinx index.

I'll need to read up a bit more on the ES options but so far it seems great.
 
Top Bottom