Hello,
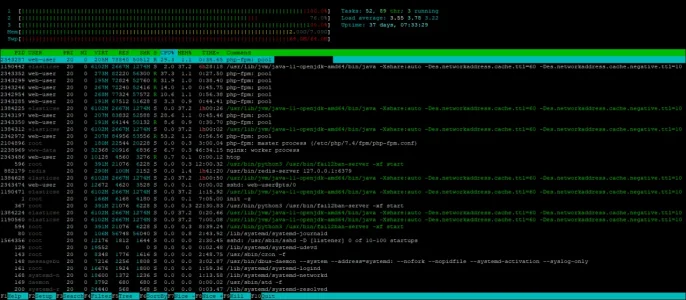
have the following problem. As soon as I activate the user caching, the server goes to its knees (CPU 100% by PHP) this also no longer normalizes. Do you have any idea where I can look?
Server:
6 CPU
13GB RAM
SSD
PHP 7.4.x
mySQL 8.x
Config Caching:
have the following problem. As soon as I activate the user caching, the server goes to its knees (CPU 100% by PHP) this also no longer normalizes. Do you have any idea where I can look?
Server:
6 CPU
13GB RAM
SSD
PHP 7.4.x
mySQL 8.x
Config Caching:
Code:
$config['cache']['enabled'] = true;
$config['cache']['namespace'] = 'xfredis_';

$config['pageCache']['enabled'] = true;
$config['pageCache']['recordSessionActivity'] = true;
$config['cache']['context']['page']['namespace'] = 'pl_';
$config['cache']['context']['page']['provider'] = 'Redis';

$config['cache']['context']['page']['config'] = [
        'host' => '127.0.0.1',
        'port' => 6379,
        ];
$config['pageCache']['lifetime'] = 120;