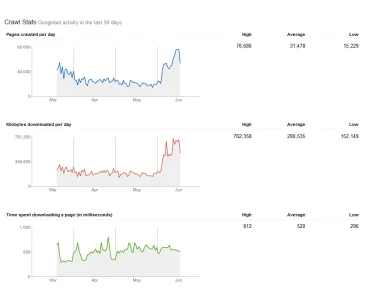
Yes.

I spent weeks looking at external requests/connections, blacklisting selected IPs, finding crawlers I didn't even know existed (which belonged to companies who sell data on
my site that they get from using
my bandwidth - well, not anymore - they made the blacklist in double-quick time ... lol), turning Google's crawler down and down, trying any number of netstat combinations to breakdown the top requesting IP addresses and then individually checking each one to see whether it was from a legit source or not (and surprisingly they all were) and basically getting nowhere - I just couldn't see "who" was making all the requests.
I then turned to Apache. I hadn't done much of anything with Apache for five years (when my server had a handful of very small sites and just 2GB RAM). It now has 8GB and is
much busier so when I looked at the Apache processes I found a lot were being spawned at quite a rate so I adjusted StartServers and SpareServers and bumped them up by quite a large number (5 to 40 - and - 5 to 20 respectively) so that there were plenty of Apache process available. This helped and lowered the load a bit and I also adjusted KeepAliveTimeout from 1 second to 3 seconds as a good compromise between spawning lots of connections at a high rate and keeping them alive a little longer for when people were navigating the site (
on the assumption that when you're navigating a familiar site you do so fairly quickly, but not as quick as 1 second per click).
It didn't solve the problem though and I was still seeing quite high loads and lots of running/spawning Apache processes and higher than normal total processes (which still had me thinking it was extra external requests). So I next looked at MySQL on the basis that it might be a bottleneck there which was causing Apache to back up and have lots open/waiting processes hanging around. I used the usual tools to check how it was doing (mysqltuner and tuningprimer) and couldn't see anything radically out of place, but decided to assess each setting, do a bit of research, and tweaked a few things; the main one being an increase in logfile size from 512M to 1GB and a reduction in size of some of the per-thread buffers.
Again this seemed to help a little but didn't fix it and only really alleviated the problem.
I was really drawing a blank. I
knew that there were lots more processes running. I
knew that the extra ones were mainly Apache. I knew, sadly, that pretty much all of the incoming (external) traffic was genuine, so it was really driving me nuts.
The one thing I didn't think about, because it never occurred to me to check, was that the extra requests might be coming from
internal connections. By chance I remembered that my server had Analog installed so I checked the previous week's report and found that one particular file had been request 2.5 million times!! WHAT?!!!
So I tailed the CycleChat access_log with a grep for the file in question and lo and behold there they were - hundreds of requests per minute - for a CometChat file!!!! It was bloody internal. Arrgghhh!!! How could I
not have spotted it??!!!
I'd installed CometChat for a few members who'd previously enjoyed the "live" chat we have with IP.Board. As part of the setup for live chat I'd added a usergroup promotion so that anyone who had been registered for more than three months was added to the chat usergroup (
2,200 members). CometChat was therefore loading the chat toolbar and polling the chat service for every request made by the hundreds of regulars who visit CycleChat each day and at peak periods there were masses of these polling requests adding an overhead to the server load.
When I looked at the CometChat logs I found that only 64 people had actually tried it, and even fewer still were using it regularly, so I flipped it around. I removed everyone from the chat usergroup, told all the members what was happening and why, and then asked the people who
wanted to use it to let me know and subscribed just those few - so far only 35 people.
Overnight the load reduced a little but I still had quite a lot of requests appearing in the logs. However, over the coming days as people's cache expired the requests for the file lowered to the point where the server load, even at our busiest time was below 1.00 - YES!!! Finally!!!
So, it was pretty much an oversight on my part subscribing so many members to CometChat on top of everything else the server was doing (runs a number of other sites too) and causing an overhead of wasted connections (98%+) that took me a while to find.
Load is even better than before now with the Apache and MySQL tweaks so I has happy.

Cheers,
Shaun


