Clip The Apex

Looking better and better every time see your site.

J/W.. Why the square ad near the footer leaving all that white space instead of a full width banner?
 
The available width there is only around 680px (due to the sidebar) so I just opted to go for a large square ad than a banner, just to mix it up a bit from the banner at the top.
 
I think it looks fine but you wouldn't go wrong with UI.X and some racing imagery. I'd wait though as I think they are working on a big feature update.
 
Hi there Brogan,

We are going to start a competition where we will try to simulate some things from the Formula 1.

I was considering doing something like what you did with: Race Hub.


Is it possible for you to somehow share your work either by pointing us in the right direction or selling us a copy so we could use it?


It’s a competition for fun at our forum but I would really like to have a place where statistics, like the ones you have, could be seen by the participants.
What exactly are you looking for? He is using pages and google api to create the charts/tables.
 
Thanks for the info. I don’t know if it is appropriate to hijack his thread with this, and in case it isn’t ill start a new thread, but I guess I have no idea of the google api thing.


I’m looking for a way to display statistics and general information about how the competition is doing. Since we have Teams, Drivers and Races maybe something like what he is doing would help.
I can send you example code to put into your pages to see what it looks like if you want (both for charts and tables)...that is what brogan is using as per http://xenforo.com/community/threads/clip-the-apex.19440/page-3#post-350968

You would probably need to have a look at flot and data tables to modify it to suit your taste.

graph
Code:
<script type="text/javascript" src="http://www.google.com/jsapi"></script>
    <script type="text/javascript">
      google.load('visualization', '1', {packages: ['corechart']});
    </script>
    <script type="text/javascript">
      function drawVisualization() {
  // Create and populate the data table.
  var data = google.visualization.arrayToDataTable([
    ['Month', 'John Monie', 'Frank Endacott', 'Mark Graham', 'Daniel Anderson', 'Tony Kemp', 'Ivan Cleary', 'Average'],
    ['1995',      10,            0,                  0,             0,                 0,            0,             9.05],
    ['1996',      11,            0,                  0,             0,                 0,            0,             9.05],
    ['1997',       7,            7,                  0,             0,                 0,            0,             9.05],
    ['1998',       0,            15,                 0,             0,                 0,            0,             9.05],
    ['1999',       0,            0,                  11,            0,                 0,            0,             9.05],
    ['2000',       0,            0,                  13,            0,                 0,            0,             9.05],
    ['2001',       0,            0,                  0,             8,                 0,            0,             9.05],
    ['2002',       0,            0,                  0,             1,                 0,            0,             9.05],
    ['2003',       0,            0,                  0,             6,                 0,            0,             9.05],
    ['2004',       0,            0,                  0,             14,                14,           0,             9.05],
    ['2005',       0,            0,                  0,             0,                 11,           0,             9.05],
    ['2006',       0,            0,                  0,             0,                 0,            10,            9.05],
    ['2007',       0,            0,                  0,             0,                 0,            4,             9.05],
    ['2008',       0,            0,                  0,             0,                 0,            8,             9.05],
    ['2009',       0,            0,                  0,             0,                 0,            14,            9.05],
    ['2010',       0,            0,                  0,             0,                 0,            5,             9.05],
    ['2011',       0,            0,                  0,             0,                 0,            6,             9.05],


  ]);


  // Create and draw the visualization.
  var ac = new google.visualization.ComboChart(document.getElementById('visualization'));
  ac.draw(data, {
    title : 'Warriors Final Standing By Year',
    width: 1100,
    height: 400,
    vAxis: {title: "Final Position"},
    hAxis: {title: "Year"},
    seriesType: "bars",
    series: {6: {type: "line"}}
  });
}

      google.setOnLoadCallback(drawVisualization);
    </script>
  </head>
  <body style="fontfamily: Arial;border: 0 none;">
    <div id="visualization" style="width: 1100px; height: 400px;"></div>

table
Code:
<script type="text/javascript" src="http://www.google.com/jsapi"></script>
    <script type="text/javascript">
      google.load('visualization', '1', {packages: ['table']});
    </script>
    <script type="text/javascript">
    function drawVisualization() {
  // Create and populate the data table.
  var data = google.visualization.arrayToDataTable([
   ['Player Name',        'Contract Status',             'Contracted Till', '2012', '2013', '2014', '2015'],
['Glen Fisiiahi',    'Current Roster',            '2015',    true,    true,    true,    true],  
['Nathan Friend',    'Current Roster',            '2013',    true,    true,    false,  false],        
['Pita Godinet',    'Current Roster',            '2013',    true,    true,    false,  false],        
['Ben Henry',        'Current Roster',            '2015',    true,    true,    true,    true],  
['Konrad Hurrell',    'Current Roster',            '2015',    true,    true,    true,    true],  
['Shaun Johnson',    'Current Roster',            '2014',    true,    true,    true,    false],   
['Jacob Lillyman',    'Current Roster',            '2014',    true,    true,    true,    false],   
['Kevin Locke',        'Current Roster',            '2013',    true,    true,    false,  false],        
['Sam Lousi',        'Current Roster',            '2013',    true,    true,    false,  false],        
['Sione Lousi',        'Current Roster',            '2013',    true,    true,    false,  false],        
['Simon Mannering',    'Current Roster',            '2015',    true,    true,    true,    true],  
['Alehana Mara',    'Current Roster',            '2013',    true,    true,    false,  false],        
['Feleti Mateo',    'Current Roster',            '2013',    true,    true,    false,  false],        
['Ben Matulino',    'Current Roster',            '2015',    true,    true,    true,    true],  
['John Palavi',        'Current Roster',            '2014',    true,    true,    true,    false],   
['Sam Rapira',        'Current Roster',            '2014',    true,    true,    true,    false],   
['Jerome Ropati',    'Current Roster',            '2013',    true,    true,    false,  false],        
['Elijah Taylor',    'Current Roster',            '2013',    true,    true,    false,  false],        
['Bill Tupou',        'Current Roster',            '2014',    true,    true,    true,    false],   
['Manu Vatuvei',    'Current Roster',            '2013',    true,    true,    false,  false],        
['Steve Rapira',    'Current Roster',            '2013',    true,    true,   false,  false],            
['Russell Packer',    'Current Roster',            '2014',    true,    true,    true,    false],   
['Dane Nielsen',    'Gains for 2013',            '2015',    false,     true,    true,    true],  
['Thomas Leuluai',    'Gains for 2013',            '2015',    false,     true,    true,    true],  
['Lewis Brown',        'Loss - Signed with Panthers 2013',    '2012',    true,    false,  false, false],             
['Ukuma Ta’ai',        'Loss - Offcontract 2013',        '2012',    true,    false,  false, false],            
['Micheal Luck',    'Loss - Retirement 2013',        '2012',    true,    false,  false, false],             
['James Maloney',    'Loss - Signed with Roosters 2013',    '2012',    true,    false,  false, false],             
['Krisnan Inu',        'Loss - 2012 Midseason Transfer to Bulldogs',    '2012',    true, false,  false, false],
['Ligi Sao',        'Loss - Signed with Manly 2013',    '2012',    true,    false,  false, false],        
['Peta Hiku',        'Loss - Signed with Manly 2013',    '2012',    true,    false,  false, false],            
['Ivan Penehe',        'Offcontract 2013',            '2012',    true,    false,  false, false],             
['Dylan Collier',    'Offcontract 2013',            '2012',    true,    false,  false, false],             
['Sebastine Ikahihifo',    'Offcontract 2013',            '2012',    true,    false,  false, false],             
['Omar Slaimankhel',    'Loss - Off to play Rugby in Japan',            '2012',    true,    false,  false, false],
['Todd Lowrie',    'Gain - Two year deal starting 2013',            '2014',    false,    true,  true, false]   
  ]);

  // Create and draw the visualization.
  visualization = new google.visualization.Table(document.getElementById('table'));
  visualization.draw(data, null);
}


    google.setOnLoadCallback(drawVisualization);
    </script>
  </head>
  <body style="font-family: Arial;border: 0 none;">
    <div id="table"></div>
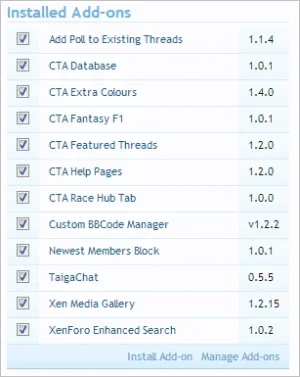
@Motobaka if you want to see what the code looks like pm me and ill open up the pages that display that code.

sorry about hijacking your thread brogan, just helping another community member out.
 
No problem guys.

Currently it's all manual but it's on my list of things to do to automate it and swap the Google API for jquery data tables and flot.

One of these days...
 
Clicking the Forum tab will do that.

It is already highlighted because the threads route is being used (just as it is when reading this thread for example).

There's no point having a Home tab unless you have a separate home/landing page as the primary function of it in XenForo is for an external link and it isn't possible to focus it - see this thread: http://xenforo.com/community/threads/this-_routematch-setsections-home.66871/

I agree though, it's not ideal and perhaps slightly confusing/misleading.
 
Top Bottom