Scandal
Well-known member
Hello all!
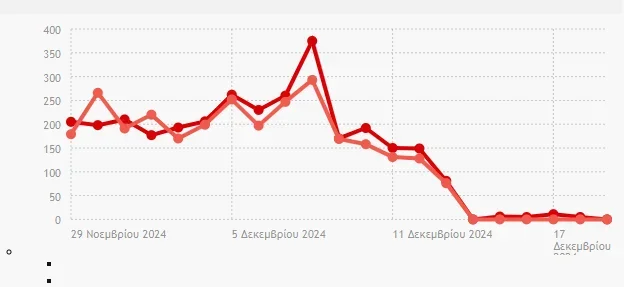
I'm trying to show a graph on the public site, inside a tab pane (tabs).
But I'm receiving error on message.js.
The strange thing is that if I open the developer console, graph shows as should. But after a page refresh (even with closed the browser console), it is still buggy.
If I apply the stats graph outside the tabs system, it works as expected.
Here is what I can see if I open / refresh the page inside the tab pane:

and here if I close console / re-open the console (no bug).

My code examples:

Any idea? Please save my life
I'm trying to show a graph on the public site, inside a tab pane (tabs).
But I'm receiving error on message.js.
The strange thing is that if I open the developer console, graph shows as should. But after a page refresh (even with closed the browser console), it is still buggy.
If I apply the stats graph outside the tabs system, it works as expected.
Here is what I can see if I open / refresh the page inside the tab pane:

and here if I close console / re-open the console (no bug).

My code examples:
HTML:
    <h2 class="block-tabHeader block-tabHeader--homeTabs tabs hScroller"
                data-xf-init="tabs h-scroller"
                data-panes=".js-homeTabPanes"
                data-state="replace"
                role="tablist">
                <span class="hScroller-scroll">
                        <a href="javascript:void(0)"
                                class="tabs-tab"
                                role="tab" rel="nofollow" id="home-users"
                                aria-controls="home-users">Χρήστες</a>
                </span>
    </h2>
    <ul class="tabPanes js-homeTabPanes">

     <li role="tabpanel" id="home-users">
                <xf:if is="$stats_data.graph_data">
                    <xf:css src="public:chartist.css" />
                    <xf:css src="admin:stats.less" />
                    <xf:js prod="xf/stats-compiled.js" dev="vendor/chartist/chartist.min.js, xf/stats.js" />

                    <ul class="graphList">
                        <li data-xf-init="stats" data-max-ticks="4">
                                <script class="js-statsData" type="application/json">
                                    {$stats_data.graph_data.data|json|raw}
                                </script>
                                <script class="js-statsSeriesLabels" type="application/json">
                                    {$stats_data.graph_data.displayTypesPhrased|json|raw}
                                </script>
                                <div class="ct-chart ct-chart--small ct-major-tenth js-statsChart"></div>
                                <ul class="ct-legend js-statsLegend"></ul>
                        </li>
                    </ul>
                </xf:if>
            </li>
</ul>
Any idea? Please save my life