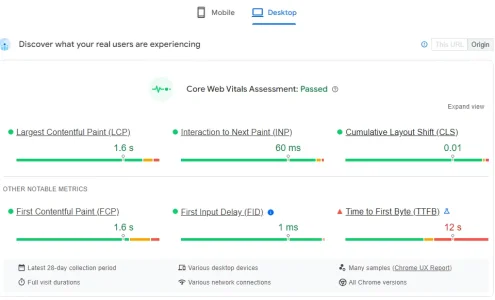
How does it figure that I have a TTFB of 12 seconds on desktop and 1.3 on slow 4G mobile? Makes absolutely no sense at all when at Slow 4G throttling it's fully loaded in 2 seconds. And by god they really did gimp the F out of the 4g throttling...
So for desktop, it is "fully loaded" in 1 second flat (on their test) but yet supposedly has a TTFB of 12 seconds? How is that possible? Pingdom, cloudflare testing, webpagetest & gtmetrix all disagree with googles "12 second TTFB". I don't understand this at all, do you?? Like how TF is desktop testing going to be worse than a mobile result.... HOW?? Someone, please try to explain this weird methodology that google has.. I'm all ears.
 pagespeed.web.dev
Code:
Network throttling: 150 ms TCP RTT, 1,638.4 kb/s throughput (Simulated)
Browser location: North America
So for desktop, it is "fully loaded" in 1 second flat (on their test) but yet supposedly has a TTFB of 12 seconds? How is that possible? Pingdom, cloudflare testing, webpagetest & gtmetrix all disagree with googles "12 second TTFB". I don't understand this at all, do you?? Like how TF is desktop testing going to be worse than a mobile result.... HOW?? Someone, please try to explain this weird methodology that google has.. I'm all ears.
PageSpeed Insights
pagespeed.web.dev
Attachments
Last edited: